
Datasheet
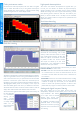


Advanced triggers
As well as the standard range
of triggers found on most
oscilloscopes, the PicoScope
6000 Series has a built-in set
of advanced triggers to help
you capture the data you
need.
All triggering is digital, resulting in high threshold resolution with
programmable hysteresis and optimal waveform stability.
Maths channels
With PicoScope 6 you can perform a variety of mathematical
calculations on your input signals. You can calculate the sum,
difference, product or inverse, or create your own custom function
using standard arithmetic, exponential and trigonometric functions.
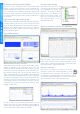
Automatic measurements
PicoScope allows you to automatically display a table of calculated
measurements for troubleshooting and analysis.
Using the built-in measurement statistics you can see the average,
standard deviation, maximum and minimum of each measurement
as well as the live value.
You can add as many measurements as you need on each view. Each
measurement includes statistical parameters showing its variability.
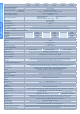
For information on the measurements available in scope
and spectrum modes, see Automatic Measurements in the
Specifications table.
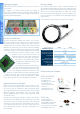
PicoScope 6000 Series PC Oscilloscopes
Digital triggering
Most digital oscilloscopes sold today still use an analog trigger
architecture based on comparators. This can cause time and
amplitude errors that cannot always be calibrated out. The use of
comparators often limits the trigger sensitivity at high bandwidths.
In 1991 Pico pioneered the use of fully digital triggering using the
actual digitized data. This technique reduces trigger errors and
allows our oscilloscopes to trigger on the smallest signals, even
at the full bandwidth. Trigger levels and hysteresis can be set with
high precision and resolution.
Digital triggering also reduces re-arm delay and this, combined
with the segmented memory, allows the triggering and capture of
events that happen in rapid sequence. At the fastest timebase you
can use rapid triggering to collect 10,000 waveforms in under 10
milliseconds. The mask limit testing function can then scan through
these waveforms to highlight any failed waveforms for viewing in
the waveform buffer.
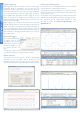
11 spectrum mode measurements
15 scope mode measurements
15 scope mode measurements
11 spectrum mode measurements