
Manual

2. For manually entered data, click the Run Addition button.
3. Enter or record the data for each bar.
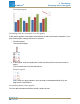
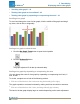
Adding additional data runs to a bar graph using sensor readings
You can show multiple data sets in a bar graph at once.
1. For data collected using a sensor, click the Record Arrow.
2. Click the Check mark to stop collecting for the current bar and move to the next
bar.
Note: the bar will remain gray if it does not have a name assigned to it.
3. Click the Stop button to stop collecting data.
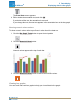
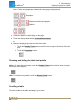
Showing and hiding data runs in a bar graph
1. Click the graph legend.
The legend enlarges to show available data runs.
2. Select or clear (Click)the check box next to each data run that you want to show or
hide.
3. Optionally, click outside the legend to reduce the size of the legend.
Document Number: 012-11074D 39
SPARKvue
®
5 Data display
Displaying data in a bar graph