
Manual

Note: Tables and graphs are disabled for some page configurations.
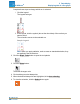
Examples:
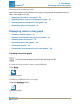
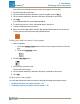
Disabled for tables and graphs
Enabled
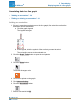
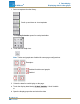
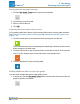
3. Select the data for each display on the page.
a. Touch the display data label(s): Select Measurement
or
b. Open the display properties and select the data.
i. Touch the Display Tools button near the lower or upper left corner of the dis-
play.
ii. Touch the Properties button.
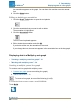
Add a vertical axis:
1. Open the properties.
i. Touch the Display Tools button near the lower or upper left corner of the dis-
play.
ii. Touch the Properties button.
2. Click Add Vertical Axis.
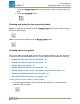
3. Click Measurement and select the second measurement.
Note: Axis y1 is the outside axis and y2 is the inside axis.
4. Click OK.
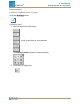
A graph with multiple y-axes displays.
Document Number: 012-11074D 33
SPARKvue
®
5 Data display
Displaying data in a line graph