
Manual
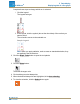

An annotation appears on the graph. You can then click and the move the annota-
tion.
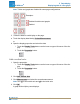
8. Click the Select button.
Editing or deleting an annotation
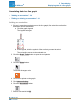
1. Click the Graph Tools button to open the tool palette.
2. Click the annotation that you want to edit or delete.
The annotation is highlighted.
3. Click the Annotation button.
The on-screen keyboard appears.
4. Edit or delete the annotation and click OK.
If you delete all the text, the annotation is removed.
If you change the text, the new text appears in the annotation box on the bar graph.
Displaying data in a Multiple y-axis graph
n
"Creating a multiple y-axes line graph": 31
n
"Working with multiple y-axes": 34
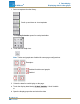
Creating a multiple y-axes line graph
To create a new line graph with multiple y-axes:
I. Create a line graph (or use an existing line graph)
II. "Add a vertical axis:": 33
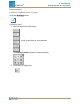
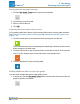
To create a line graph, do one of the following (A or B):
A. From the Home screen create a new SPARKlab:
Touch Build.
Document Number: 012-11074D 31
SPARKvue
®
5 Data display
Displaying data in a line graph