
Manual

Line
Graph
Digits Table
Bar Graph Meter Camera
Media Text
Assess-
ment
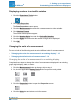
3. For Text Boxes: Type in text into the Text Box.
4. For Cameras: Touch the Image Tools button. See Capturing a camera image.
5. For other data displays: Select the data for each display on the page.
a. Touch the display data label(s), for example: Select Measurement, X-Axis Vari-
able, Y-Axis Variable, Select a Media File, Add an Assessment
or
b. Open the display properties and select the data.
i. Touch the Display Tools button near the lower or upper left corner of the dis-
play.
ii. Touch the Properties button.
Add additional pages:
Repeatedly click the New Page button to add pages to your SPARKlab.
Document Number: 012-11074D 11
SPARKvue
®
2 Starting an experiment
Moving on from the Home screen