User's Guide Version 2.
SPARKvue® User's Guide SPARKvue disclaimers Document Number: 012-11074D Version 2.0 Limited Warranty For a description of the product warranty, see the PASCO catalog. Copyright This user’s guide is copyrighted with all rights reserved. Permission is granted to nonprofit educational institutions for reproduction of any part of this manual, providing the reproductions are used only in their laboratories and classrooms, and are not sold for profit.
SPARKvue® Teacher and Technical Support Teacher and Technical Support For help with SPARKvue and other PASCO products, you can contact PASCO Teacher and Technical Support staff by phone, email, or on the Web. Phone: 1-800-772-8700 (in the U.S.) +1 916 786 3800 (worldwide) Email: support@pasco.com Web: www.pasco.com/support/ Tech Notes: www.pasco.
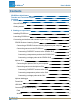
SPARKvue® User's Guide Contents SPARKvue disclaimers Teacher and Technical Support Contents 1 Introduction i ii iii 1 About SPARKvue 1 Getting started 1 2 Starting an experiment 2 Installing SPARKvue 2 Launching SPARKvue 2 Connecting an interface and sensors to your computer 2 SPARK Science Learning System 3 Connecting a SPARK Science Learning System to your computer 3 Connecting sensors to the SPARKvue 4 Connecting PASPORT sensors to the SPARK SLS 4 Connecting a temperature probe to
SPARKvue® User's Guide Mac and Windows Connecting multiple interfaces to your computer 7 8 Monitoring live data 8 Moving on from the Home screen 8 Opening a SPARKlab 9 Showing a SPARKlab 9 Building a SPARKlab 10 A. From the Home screen create a new SPARKlab: 10 B.
SPARKvue® User's Guide Performing a 1-point slope-only calibration 18 Calibrating a Drop Count sensor (example) 18 Using sensor adapters 19 Connecting a sensor through a Digital Adapter or Photogate Port 19 Connecting a sensor through an Analog Adapter 20 4 Data recording 21 Recording a run of periodically sampled data 21 Recording a set of manually sampled data 21 Deleting data runs 22 5 Data display 23 Displaying data in a line graph 23 Creating a new line graph 23 A.
SPARKvue® User's Guide Creating a multiple y-axes line graph 31 A. From the Home screen create a new SPARKlab: 31 B. Within a SPARKlab add a new page: 32 Working with multiple y-axes 34 Displaying data in a bar graph 34 Creating a new bar graph 34 A. From the Home screen create a new SPARKlab: 34 B.
SPARKvue® User's Guide Displaying data in a table Creating a table 44 44 A. From the Home screen create a new SPARKlab: 44 B.
SPARKvue® User's Guide 6 Image capture 57 Connecting a camera or other video device 57 Creating a new camera image 57 A. From the Home screen create a new SPARKlab: 57 B.
SPARKvue® User's Guide Moving an annotation 69 Editing an annotation 69 Deleting an annotation 69 Naming an image 70 Deleting and Renaming an image 70 Exporting an image 71 7 Data analysis 72 Analyzing data in a graph 72 Viewing statistics in a line graph 72 Applying a curve fit 74 Removing a curve fit 75 Drawing a prediction 75 Finding the x- and y-values of a point 75 Finding the x- and y-difference between two points 77 Finding the slope at a point on a data plot 78 Findin
SPARKvue® User's Guide Opening the measurements list 90 View the available measurements 90 View the available User-entered Data 91 Creating a data set for manual entry 91 Creating a data set for manually entered numbers 91 Creating a data set for manually entered text 91 Preparing a table for manual data entry 91 Entering data into a manual data set 92 Displaying manually entered data 92 Editing manually entered data 93 Enter User-defined Data 9 Building SPARKlab pages Starting a new S
SPARKvue® User's Guide Open a file from Online Storage Services 101 Save a file to Online Storage Services 101 11 Keeping a journal 102 Taking a snapshot 102 Opening the journal 102 Adding a caption to a snapshot or editing an existing caption 103 Navigating in the journal 103 Deleting a journal entry or snapshot 103 Rearranging journal entries 103 Closing the journal 103 Saving a journal 104 Printing a journal 104 12 Common tasks 105 Turning pages 105 Returning to the Home scr
1 Introduction About SPARKvue SPARKvue® 1 Introduction n "About SPARKvue": 1 n "Getting started": 1 n "Teacher and Technical Support": ii About SPARKvue SPARKvue software combines multimedia curriculum, real-time data collection, and powerful scientific analysis tools in an easy-to-use, icon-based user interface. SPARKvue is compatible with all PASCO PASPORT sensors and interfaces.
2 Starting an experiment Installing SPARKvue SPARKvue® 2 Starting an experiment 1. "Installing SPARKvue": 2 2. "Launching SPARKvue": 2 3. "Connecting an interface and sensors to your computer": 2 4. "Monitoring live data": 8 Installing SPARKvue 1. Download SPARKvue from www.pasco.com/sparkvue/ or insert the SPARKvue USB drive into your computer. 2. Follow the instructions provided with the download or USB drive to complete the installation. Launching SPARKvue Click the SPARKvue icon to launch SPARKvue.
SPARKvue® 2 Starting an experiment Connecting an interface and sensors to your computer n "SPARK Science Learning System": 3 n "Xplorer GLX": 5 n "Xplorer datalogger": 6 n "PowerLink": 6 n "USB Link": 6 n "Connecting a bluetooth device": 6 n "Connecting multiple interfaces to your computer": 8 SPARK Science Learning System The SPARK Science Learning System (SPARK) includes ports for two PASPORT sensors, a temperature probe, and a voltage probe.
SPARKvue® 2 Starting an experiment Connecting an interface and sensors to your computer Connecting sensors to the SPARKvue PASPORT ports. Temperature port. Voltage port. You can use up to two PASPORT sensors plus a temperature probe and a voltage probe. Complete one or more of the following tasks to connect sensors to the SPARK.
SPARKvue® 2 Starting an experiment Connecting an interface and sensors to your computer Xplorer GLX The Xplorer GLX includes ports for four PASPORT sensors, two temperature probes, and a voltage probe. When it is not connected to a computer, the device records data and displays it on its own screen; however, when connected to a computer, it passes data through to be recorded and displayed on the computer. It is powered either by its AC adapter, or by its rechargeable battery.
SPARKvue® 2 Starting an experiment Connecting an interface and sensors to your computer Connecting a voltage probe to the GLX Plug the included voltage probe into the voltage port on the left side of the GLX. Xplorer datalogger The Xplorer datalogger contains a single port for a PASPORT sensor. When it is not connected to a computer, the device records data and displays it on its own screen; however, when connected to a computer, it passes data through to be recorded and displayed on the computer.
SPARKvue® 2 Starting an experiment Connecting an interface and sensors to your computer The AirLink2 and SPARKlink Air can also connect via USB. Note: If prompted, enter pass code "1234" for SPARKlink Air devices. iPad 1. Use the standard iPad process to pair the PASCO bluetooth device. 2. Connect sensors as needed. Android 1. Use the standard Android process to pair the PASCO bluetooth device. 2. Continue to step 1 of the Mac and Windows process.
2 Starting an experiment Monitoring live data SPARKvue® 1. Click the Device Tools button to open the Device Tools screen. 2. Click the Connect Sensor via Bluetooth button. 3. Click Disconnect. The selected device will change from Disconnect to Connect upon successful connection. 4. Click OK twice to close the Device Tools screen. Connecting multiple interfaces to your computer n n n If the computer has enough available USB ports, connect each interface to a USB on the computer.
2 Starting an experiment Moving on from the Home screen SPARKvue® Opening a SPARKlab SPARKvue includes embedded SPARKlabs. Additional no-cost labs are available from PASCO. Complete these steps to open a SPARKlab: 1. Connect the sensors required for the SPARKlab that you wish to do. 2. If there are unneeded sensors connected, disconnect them. 3. In the SPARKlabs pane, navigate to the folder containing the SPARKlab that you would like to open. 4. Click a SPARKlab to preview.
2 Starting an experiment Moving on from the Home screen SPARKvue® Building a SPARKlab When you build a custom SPARKlab, you design each page with your choice of measurements and displays. You can also add text and pictures. Connect a sensor (or sensors) and complete these steps to start building a SPARKlab. A. From the Home screen create a new SPARKlab: Touch Build. Continue to step 1. B. Within a SPARKlab add a new page: Touch the New Page button. Continue to step 1. 1.
2 Starting an experiment Moving on from the Home screen SPARKvue® Line Graph Digits Table Bar Graph Meter Camera Media Text Assessment 3. For Text Boxes: Type in text into the Text Box. 4. For Cameras: Touch the Image Tools button. See Capturing a camera image. 5. For other data displays: Select the data for each display on the page. a. Touch the display data label(s), for example: Select Measurement, X-Axis Variable, Y-Axis Variable, Select a Media File, Add an Assessment or b.
3 Setting up an experiment Customizing data collection SPARKvue® 3 Setting up an experiment n "Customizing data collection": 12 n "Customizing how numbers are displayed": 14 n "Calibrating sensors": 16 n "Using sensor adapters": 19 Customizing data collection You can start recording data using the default settings, or complete one or more of the following tasks to change the sampling rate or sampling mode.
3 Setting up an experiment Customizing data collection SPARKvue® 1. Click the Sampling Options button. The Sampling Options screen opens. 2. Click Periodic. 3. Click OK. Putting SPARKvue into manual sampling mode In manual sampling mode, a single value from each measurement is recorded each time you manually trigger SPARKvue. Complete these steps to put SPARKvue into manual sampling mode: 1. Click the Sampling Options button. The Sampling Options screen opens. 2. Click Manual. 3. Click OK.
3 Setting up an experiment Customizing how numbers are displayed SPARKvue® Customizing how numbers are displayed n "Setting the number of decimal places displayed": 14 n "Setting the number of significant figures displayed": 14 n "Displaying numbers in scientific notation": 15 n "Changing the units of a measurement": 15 Setting the number of decimal places displayed 1. Click the Experiment Tools button. The Experiment Tools screen opens. 2. Click Data Properties. The Data Properties screen opens.
3 Setting up an experiment Customizing how numbers are displayed SPARKvue® Displaying numbers in scientific notation 1. Click the Experiment Tools button. 2. Click Data Properties. The Data Properties screen opens. 3. Click the Measurement box and click a measurement or other variable. 4. Click Number Format. The number format options appear. 5. Click the Number Style: box and click Scientific Notation. 6. Click the Digits box and select the number of digits to be displayed. 7. Click OK.
3 Setting up an experiment Calibrating sensors SPARKvue® 5. Click OK. The display shows the measurement with the selected units. Changing the default units of a measurement Complete these steps to change the units that will be used by default when you select a measurement in the future: 1. Click the Experiment Tools button to open the Experiment Tools screen. Note: The Experiment Tools button is visible in data collection mode. 2. Click Data Properties to open the Data Properties screen. 3.
3 Setting up an experiment Calibrating sensors SPARKvue® 4. Click the Measurement box and click the measurement to be calibrated. 5. Click the Calibration Type box and click a calibration type. See the instructions provided with your sensor for information about what type of calibration is appropriate for your sensor. 6. Click Next. The Calibrate Sensor Enter Values screen opens. 7. Continue to "Performing a calibration": 17.
3 Setting up an experiment Calibrating sensors SPARKvue® Performing a 1-point offset-only calibration In the Calibrate Sensor Enter Values screen, complete these steps: 1. Apply a known quantity to the sensor. For example, place a temperature probe in ice water known to be 0 °C. 2. Under Calibration Point 1 Click the Standard Value box and enter the known value. For example, enter the known temperature of the water. 3. Under Calibration Point 1 Click Read From Sensor.
3 Setting up an experiment Using sensor adapters SPARKvue® 5. Align the drop tip with the opening in the Drop Counter. Put a graduated 10 mL cylinder under the Drop Counter opening. 6. While on the Home screen, open the bottom stopcock to allow titrant to flow. 7. After about 10 mL of titrant is collected in the graduated cylinder, close the bottom stopcock. 8. Record the exact volume from the graduated cylinder. 9. Build the desired display for you experiment. 10. Click the Experiment Tools button.
3 Setting up an experiment Using sensor adapters SPARKvue® The Photogate Port (PS-2123) is a type of adapter that supports switch-type sensors, but not the Rotary Motion Sensor or Motion Sensor. Complete these steps to connect and configure a sensor with a Digital Adapter or Photogate Port: 1. Connect the adapter to your PASPORT interface. 2. Connect a digital sensor to the adapter. You can connect a switch-type sensor to either port of the adapter.
4 Data recording Recording a run of periodically sampled data SPARKvue® 4 Data recording The following tasks describe how to record a data run with SPARKvue in periodic sampling mode and manual sampling mode. Note: Over the course of a science investigation, you can record multiple data runs and sets.
4 Data recording Deleting data runs SPARKvue® You can record data with any type of display visible (or no display at all), but it is typical to record manually sampled data while looking at a table. 2. Click the Start button. SPARKvue creates a new data set. Live data appear in the data displays. 3. When you are ready to record a data point, click the Keep button. SPARKvue records a single value from each measurement. 4.
5 Data display Displaying data in a line graph SPARKvue® 5 Data display n "Displaying data in a line graph": 23 n "Displaying data in a bar graph": 34 n "Displaying data in a Multiple y-axis graph": 31 n "Displaying data in a table": 44 n "Displaying data in a digits display": 50 n "Displaying data in a meter": 52 Displaying data in a line graph n "Creating a new line graph": 23 n "Showing and hiding the line graph tool palette": 25 n "Adjusting the scale of a line graph": 25 n "Selecti
5 Data display Displaying data in a line graph SPARKvue® Continue to step 1. 1. Select a template from the library. Scroll up and down to view templates The Display Selection opens for each placeholder. 2. Touch the Line Graph icon. Note: Tables and graphs are disabled for some page configurations. Examples: Disabled for tables and graphs Enabled 3. Select the data for each display on the page. a.
5 Data display Displaying data in a line graph SPARKvue® b. Open the display properties and select the data. i. Touch the Display Tools button near the lower or upper left corner of the display. ii. Touch the Properties button. Showing and hiding the line graph tool palette Show: To show the tool palette, touch the Display Tools button near the lower or upper left corner of the display. Hide: To hide the tool palette, touch the Display Tools button.
5 Data display Displaying data in a line graph SPARKvue® Scaling by direct manipulation Complete one or more of these steps in any order: n Click one of the numbers labeling the x-scale of the graph and drag it left or right. The graph expands or contracts horizontally. n Click one of the numbers labeling the y-scale of the graph and drag it up or down. The graph expands or contracts vertically. n Click the middle of the graph and drag it in any direction. The graph moves.
5 Data display Displaying data in a line graph SPARKvue® 2. Select or clear (Click) the check box next to each data run that you want to show or hide. 3. Optionally, click outside the legend to reduce the size of the legend. Graph legend Changing the variable on the x- or y-axis 1. Click the Measurement button to change; skip to step 4. 2. Or, click the applicable Display Tools button to open the tools palette. 3. Click the Properties button to open the Properties screen. 4.
5 Data display Displaying data in a line graph SPARKvue® Selecting data for operation in a line graph n "Selecting a data run for operation in a line graph": 28 n "Selecting part of a data run for operation in a line graph": 28 Selecting a data run for operation in a line graph In the display legend, a red outline surrounds the run that is selected for operation. Complete these steps to change which run is selected: i. Click the legend. The legend enlarges. ii.
5 Data display Displaying data in a line graph SPARKvue® Complete these steps to change which run is selected: i. Click the legend. The legend enlarges. ii. In the legend, click the symbol (but not the check box) of the run that you want to select. The red outline moves to the selected run. Sample Legend Note: When you apply statistics, such as mean or standard deviation, they are applied to the selected run. 2. Click the Graph Tools button to open the tool palette. 3. Click the Select button.
5 Data display Displaying data in a line graph SPARKvue® Annotating data in a line graph n "Adding an annotation": 30 n "Editing or deleting an annotation": 31 Adding an annotation 1. If there is more than one data run on the line graph, first select the run that the annotation will be attached to: a. Click the graph legend. The legend enlarges. b. In the legend, click the symbol of the run that you want to select. The red outline moves to the selected run. 2.
5 Data display Displaying data in a line graph SPARKvue® An annotation appears on the graph. You can then click and the move the annotation. 8. Click the Select button. Editing or deleting an annotation 1. Click the Graph Tools button to open the tool palette. 2. Click the annotation that you want to edit or delete. The annotation is highlighted. 3. Click the Annotation button. The on-screen keyboard appears. 4. Edit or delete the annotation and click OK.
5 Data display Displaying data in a line graph SPARKvue® Continue to step 1. B. Within a SPARKlab add a new page: Touch the New Page button. Continue to step 1. 1. Select a template from the library. Scroll up and down to view templates The Display Selection opens for each placeholder. 2. Touch the Line Graph icon.
5 Data display Displaying data in a line graph SPARKvue® Note: Tables and graphs are disabled for some page configurations. Examples: Disabled for tables and graphs Enabled 3. Select the data for each display on the page. a. Touch the display data label(s): Select Measurement or b. Open the display properties and select the data. i. Touch the Display Tools button near the lower or upper left corner of the display. ii. Touch the Properties button. Add a vertical axis: 1. Open the properties. i.
5 Data display Displaying data in a bar graph SPARKvue® Working with multiple y-axes Most of the actions you can perform on a single y-axis graph can be performed on multiple y-axes graphs.
5 Data display Displaying data in a bar graph SPARKvue® 1. Select a template from the library. Scroll up and down to view templates The Display Selection opens for each placeholder. 2. Touch the Bar Graph icon. Note: Tables and graphs are disabled for some page configurations. Examples: Disabled for tables and graphs Enabled 3. Select the data for each display on the page. a. Touch the display data label(s): X-Axis Variable, Y-Axis Variable or b. Open the display properties and select the data.
5 Data display Displaying data in a bar graph SPARKvue® i. Touch the Display Tools button near the lower or upper left corner of the display. ii. Touch the Properties button. Showing and hiding the bar graph tool palette Show: To show the tool palette, touch the Display Tools button near the lower or upper left corner of the display. Hide: To hide the tool palette, touch the Display Tools button. Showing data in bar graphs When you create a new bar graph, the first bar is already created for you.
5 Data display Displaying data in a bar graph SPARKvue® Note: this tool will already be active when a bar graph is first created. 2. Click the bar with muted color. 3. Click the default bar name above the numeric keypad, such as Bar 1 4. Click in the bar name box, delete the old name, and enter a new name. 5. Click OK. A new placeholder bar is automatically added. 6. To name the new bar, click it, and repeat steps 2 through 4. 7. Continue adding the bars you need. 8.
5 Data display Displaying data in a bar graph SPARKvue® Entering data into bar graph manually 1. Click the Bar Graph Tools button to open the tool palette. 2. Click the bar you want to edit. 3. Enter a value for the bar. 4. Click OK. Collecting data for bar graph using a sensor It is recommended that the bars are given names either before or during data collection. See Editing bars and bar names in bar graphs and "Adding bars and bar names in bar graphs": 36. 1.
5 Data display Displaying data in a bar graph SPARKvue® 2. For manually entered data, click the Run Addition button. 3. Enter or record the data for each bar. Adding additional data runs to a bar graph using sensor readings You can show multiple data sets in a bar graph at once. 1. For data collected using a sensor, click the Record Arrow. 2. Click the Check mark to stop collecting for the current bar and move to the next bar. Note: the bar will remain gray if it does not have a name assigned to it.
5 Data display Displaying data in a bar graph SPARKvue® Bar Graph legend Selecting data for operation in a bar graph In the display legend, a red outline surrounds the run that is selected for operation. Complete these steps to change which run is selected: i. Click the legend. The legend enlarges. ii. In the legend, click the symbol (but not the check box) of the run that you want to select. The red outline moves to the selected run.
5 Data display Displaying data in a bar graph SPARKvue® n "Adding annotations to bars": 41 n "Editing or deleting annotations to bars": 41 n "Showing numeric values on bars": 42 Adding annotations to bars If there is more than one data run on the graph, first select the run that the annotation will be attached to: 1. Click the graph legend. The legend enlarges. 2. In the legend, click the symbol of the run(s) that you want to annotate. 3. click the Bar Graph Tools button to open the tool palette.
5 Data display Displaying data in a bar graph SPARKvue® The Enter Note screen appears. 4. Edit or delete the annotation text, and click OK. If you delete all the text, the annotation is removed. If you change the text, the new text appears in the annotation box on the bar graph. Showing numeric values on bars To show numeric values at the tops of bars in a bar chart for a data run: 1. Click the Bar Graph Tools button to open the tool palette. 2. Click the Numeric Values button.
5 Data display Displaying data in a bar graph SPARKvue® n "Scrolling a bar graph": 43 n "Scaling a bar graph to show all data": 43 n "Scaling a bar graph by expanding or compressing the axes": 43 Scrolling a bar graph To scroll and change the view of a bar graph, click the middle of the graph and drag it up, down, side-to-side, or diagonally. Scaling a bar graph to show all data 1. Click the Bar Graph Tools button to open the tool palette. 2. Click the Scale-to-fit button.
5 Data display Displaying data in a table SPARKvue® Customizing axes labels and units on bar graphs To create an axis label: 1. Open Properties: i. Touch the Display Tools button near the lower or upper left corner of the display. ii. Touch the Properties button. 2. Click the Measurement box for either the X-axis variable or Y-axis variable. 3. Click User-entered. 4. Click Create Data Set. The Define Data Set box displays. 5. Click the Measurement Name box. 6. Type the label text, and click OK. 7.
5 Data display Displaying data in a table SPARKvue® Continue to step 1. B. Within a SPARKlab add a new page: Touch the New Page button. Continue to step 1. 1. Select a template from the library. Scroll up and down to view templates The Display Selection opens for each placeholder. 2. Touch the Table icon.
5 Data display Displaying data in a table SPARKvue® Note: Tables and graphs are disabled for some page configurations. Examples: Disabled for tables and graphs Enabled 3. Select the data for each display on the page. a. Touch the display data label(s): Select Measurement or b. Open the display properties and select the data. i. Touch the Display Tools button near the lower or upper left corner of the display. ii. Touch the Properties button.
5 Data display Displaying data in a table SPARKvue® Selecting data to show in an existing table n "Selecting a run for display in an existing column": 47 n "Changing the variable displayed in an existing column": 47 n "Adding a column": 48 n "Removing a column": 48 Selecting a run for display in an existing column 1. Click the run number at the top of the column. A list of available runs appears. 2. Click the run that you want to see. Changing the variable displayed in an existing column 1.
5 Data display Displaying data in a table SPARKvue® Adding a column A table can contain up to six columns. Complete these steps to add a column to a table: 1. Click the Table Tools button to open the tool palette. 2. Optionally, click a position in the table where the new column will be inserted: a. Click the Select button. The button changes color. b. Click the column to the right of where you want the new column to appear.
5 Data display Displaying data in a table SPARKvue® 4. Click the Remove Column button. 5. Click OK. Selecting cells for operation in a table If a group of table cells is selected for operation, the selected cells are outlined. If statistics are displayed, they apply only to the data in the selected cells. Complete these steps to select cells: 1. Optional: select a different data run. In the display legend, a red outline surrounds the run that is selected for operation.
5 Data display Displaying data in a digits display SPARKvue® 3. Click the Select button. The button changes color. 4. On the table, drag down a column, across a row, or diagonally across rows and columns to select a group of cells. The selected group of cells is outlined. Selecting cells in a single column. ing cells in multiple columns and rows. Selecting cells in a single row. Select- 5. To clear the selection, click the Select button again.
5 Data display Displaying data in a digits display SPARKvue® Continue to step 1. B. Within a SPARKlab add a new page: Touch the New Page button. Continue to step 1. 1. Select a template from the library. Scroll up and down to view templates The Display Selection opens for each placeholder. 2. Touch the Digits icon. 3. Select the data for each display on the page. a. Touch the display data label(s): Select Measurement or b. Open the display properties and select the data. i.
5 Data display Displaying data in a meter SPARKvue® display. ii. Touch the Properties button. Showing and hiding the digits display tool palette Show: To show the tool palette, touch the Display Tools button near the lower or upper left corner of the display. Hide: To hide the tool palette, touch the Display Tools button. Changing the variable in a digits display 1. Click the Measurement button to change; skip to step 4. 2. Or, click the Display Tools button to open the tools palette. 3.
5 Data display Displaying data in a meter SPARKvue® n "Adjusting the scale of a meter": 54 n "Changing the variable displayed in a meter": 55 n "Customizing the appearance of a meter": 56 Creating a new meter To create a new meter, do one of the following (A or B): A. From the Home screen create a new SPARKlab: Touch Build. Continue to step 1. B. Within a SPARKlab add a new page: Touch the New Page button. Continue to step 1. 1. Select a template from the library.
5 Data display Displaying data in a meter SPARKvue® 2. Touch the Meter icon. 3. Select the data for each display on the page. a. Touch the display data label(s): Select Measurement or b. Open the display properties and select the data. i. Touch the Display Tools button near the lower or upper left corner of the display. ii. Touch the Properties button.
5 Data display Displaying data in a meter SPARKvue® Scaling a meter to fit all data 1. Click the Meter Tools button to open the tool palette. 2. Click the Scale-to-fit button. The scale adjusts to fit all data for the currently displayed data run. Setting the scale of a meter 1. Click the Meter Tools button to open the tool palette. 2. Click the Properties button to open the Properties screen. 3. For the Always Scale to Fit: option click Off. 4.
5 Data display Displaying data in a meter SPARKvue® able. 6. Click OK. Customizing the appearance of a meter 1. Open Properties: i. Touch the Display Tools button near the lower or upper left corner of the display. ii. Touch the Properties button. 2. Click the Sweep Range: box and click Semicircle, Small Sweep, or Large Sweep. 3. Click OK.
6 Image capture Connecting a camera or other video device SPARKvue® 6 Image capture n "Connecting a camera or other video device": 57 n "Displaying a camera image": 58 n "Showing and hiding the image tool palette": 59 n "Capturing a camera image": 60 n "Switching between live and captured camera images": 60 n "Selecting a captured camera image for display": 61 n "Adjusting the scale and position of a camera image": 61 n "Measuring in a camera image": 62 n "Drawing on a camera image": 65
6 Image capture Displaying a camera image SPARKvue® B. Within a SPARKlab add a new page: Touch the New Page button. Continue to step 1. 1. Select a template from the library. Scroll up and down to view templates The Display Selection opens for each placeholder. 2. Touch the Camera icon. Displaying a camera image From the Home screen 1. In the Home screen, click an Image measurement. When selected, Image is highlighted in color. 2. Click Show.
6 Image capture Showing and hiding the image tool palette SPARKvue® A camera image display appears in a SPARKlab. 3. Click the Live Image button at the center of the display. A live camera view appears in the display. From within a SPARKlab 1. Click the New Page button. The build a new page screen opens. 2. Select a template. See "Starting a new SPARKlab page": 94 3. Click the Live Image button at the center of the display. A camera image display appears in a SPARKlab. 4.
6 Image capture Capturing a camera image SPARKvue® Capturing a camera image See "Creating a new camera image": 57 to add a new page with a Camera element. On the page, perform the following to capture an image: 1. Click the Image Tools button to open the tool palette. 2. Click the Live Image button on the tool palette to show a live image if a live image is not displayed. A live image must be showing before you can capture a still image. When a live image is showing, the button changes color. 3.
6 Image capture Selecting a captured camera image for display SPARKvue® To switch from a live image to a previously captured still image: 1. Click the image legend. The legend expands to show all captured images. 2. Click the image to display. Selecting a captured camera image for display 1. Click the image legend. 2. The legend expands to show a list of captured images. 3. Click the image to display.
6 Image capture Measuring in a camera image SPARKvue® Zooming out In the tool palette, click the Zoom Out button. The display zooms in toward the center. Scale to fit To show the entire image, click the Scale-to-fit button. Panning a camera image You can view different parts of an image by panning, or click a point on the image and drag it left, right, diagonal, up, or down. Measuring in a camera image You can use a measurement tool on an image to measure the distance between two points.
6 Image capture Measuring in a camera image SPARKvue® 3. Optional: click the color button in the palette to change the color. 4. Click the point on the image. 5. Drag the box to the other point in the image. A leader line with length display on the image. 6. If necessary, drag the ends of the measurement tool to the desired location. 7. You can add additional measurement arrows, if needed. Moving a Measurement tool Measurements added to images can be moved. To move a measurement arrow: 1.
6 Image capture Measuring in a camera image SPARKvue® Deleting a Measurement tool Measurements added to images can be removed. To remove a measurement arrow: 1. click the Image Tools button to open the tool palette. 2. In the tool palette, click the Measurement button. The Measurement button changes color, and the measurement toolbar appears. 3. In the measurement toolbar, click the Erase button. The Erase button changes color. 4. click the box at one end of a measurement arrow.
6 Image capture Drawing on a camera image SPARKvue® A leader line with length display on the image. 5. If necessary, drag the ends of the measurement tool so that it exactly represents the known length. 6. Click the Measurement button again. 7. The Measurement button changes color, and the measurement toolbar appears. 8. In the measurement toolbar, click the Measurement button. 9. The buttons changes color. 10. Click the box at one end of the measurement arrow. 11.
6 Image capture Drawing on a camera image SPARKvue® Drawing 1. Click the Image Tools button to open the tool palette. 2. In the tool palette, click the Draw button. 3. The button changes color and the drawing toolbar appears. 4. To change the pen color, click the color button. 5. Click a point on the image and drag to draw lines. 6. Click the Draw button again in the tool palette to turn off the drawing pen and hide the drawing toolbar. Erasing 1.
6 Image capture Annotating a camera image SPARKvue® The button changes color. 5. To erase parts of a drawing, click a point on the drawing and drag over it. 6. Click the Draw button in the tool palette to close the draw palette. Erasing all 1. Click the Image Tools button to open the tool palette. 2. In the tool palette, click the Draw button. 3. The button changes color and the draw palette appears. 4. In the draw palette, click the Eraser button. The button changes color. 5.
6 Image capture Annotating a camera image SPARKvue® "Moving an annotation": 69 "Editing an annotation": 69 "Deleting an annotation": 69 Adding an annotation 1. Optional: If there is more than one image, first select the image for the annotation: a. Click the image legend. The legend expands. b. In the legend, click the image that you want to select. The red outline moves to the selected image. 2. Click the Image Tools button to open the tool palette. 3. Click the Annotate button. 4.
6 Image capture Annotating a camera image SPARKvue® 7. Enter a note and click OK. 8. An annotation appears on the image and the image annotation bar closes. 9. Optional: Drag to move the annotation text box. Moving an annotation You can move the text and pointer arrow on an annotation: l l To move annotation text on an image, click the text and drag it to a new location. To move an annotation arrow on an image, click the point of the arrow and drag it to a new location. Editing an annotation 1.
6 Image capture Naming an image SPARKvue® 5. The Eraser button changes color. 6. Click the all annotations you want to delete. 7. When you finish deleting annotations, click the Eraser button to turn off the deletion tool. 8. Click the Annotation button to close the annotation toolbar. Naming an image 1. Click the Experiment Tools button to open Experiment Tools screen. 2. Click Manage Data to open the Manage Data screen. 3. Click Manage Images to open the Manage Images screen. 4.
6 Image capture Exporting an image SPARKvue® 5. Click OK to close the Manage Images screen, click OK again to close the Manage Data screen. Exporting an image 1. Click the Sharing button to open the Sharing screen. 2. Click the Export Images tab. 3. After saving your images, click OK to return to your SPARKlab.
7 Data analysis Analyzing data in a graph SPARKvue® 7 Data analysis In any display, you can view the statistics of data runs, including minimum value, maximum value, mean value, standard deviation, and count (or number of points). In a graph, the area statistic is also available. A graph also allows you to apply curve fits; draw predictions; and find coordinates, distances, and slopes on data plots.
7 Data analysis Analyzing data in a graph SPARKvue® i. Click the legend. The legend enlarges. ii. In the legend, click the symbol (but not the check box) of the run that you want to select. The red outline moves to the selected run. Sample Legend Note: When you apply statistics, such as mean or standard deviation, they are applied to the selected run. 2. Click the Graph Tools button to open the tool palette. 3. Click the Statistics button to open the Statistics screen. 4.
7 Data analysis Analyzing data in a graph SPARKvue® Applying a curve fit Complete these steps to apply a linear, quadratic, power, inverse, inverse square, or sine fit to a data run: 1. Optional: select a different data run. In the display legend, a red outline surrounds the run that is selected for operation. Complete these steps to change which run is selected: i. Click the legend. The legend enlarges. ii. In the legend, click the symbol (but not the check box) of the run that you want to select.
7 Data analysis Analyzing data in a graph SPARKvue® The curve and parameters of the curve appear on the graph. 6. Optionally, select part of the data set for the curve fit to be applied to. See "Selecting part of a data run for operation in a line graph": 28. Removing a curve fit 1. Click the Graph Tools button to open the tool palette. 2. Click the Curve Fit button. Drawing a prediction Complete these steps to manually sketch on a graph: 1. Click the Graph Tools button to open the tool palette. 2.
7 Data analysis Analyzing data in a graph SPARKvue® 1. Optional: select a different data run. In the display legend, a red outline surrounds the run that is selected for operation. Complete these steps to change which run is selected: i. Click the legend. The legend enlarges. ii. In the legend, click the symbol (but not the check box) of the run that you want to select. The red outline moves to the selected run.
7 Data analysis Analyzing data in a graph SPARKvue® 7. The x- and y-values of the selected point are displayed. 8. Click the Graph coordinate information button again to clear the selection. Finding the x- and y-difference between two points Complete these steps to select a range of points and display the change-in-x and change-in-y between the first and last points in the selected range: 1. Optional: select a different data run.
7 Data analysis Analyzing data in a graph SPARKvue® The button changes color. 4. Click and drag to select data points. 5. When the desired data points are highlighted, click done selecting. 6. Click the Select button. 7. Click the Coordinates button.
7 Data analysis Analyzing data in a graph SPARKvue® The red outline moves to the selected run. Sample Legend Note: When you apply statistics, such as mean or standard deviation, they are applied to the selected run. 2. Click the Graph Tools button to open the tool palette. 3. Click the Slope Tool button. The Slope Tool appears on the graph displaying the slope at one point.
7 Data analysis Analyzing data in a graph SPARKvue® ii. In the legend, click the symbol (but not the check box) of the run that you want to select. The red outline moves to the selected run. Sample Legend Note: When you apply statistics, such as mean or standard deviation, they are applied to the selected run. 2. In the legend, click the symbol of the measurement run to analyze. A red outline appears around the selected run. 3. Click the Graph Tools button to open the tool palette.
7 Data analysis Analyzing data in a graph SPARKvue® Displaying the RMSE Root-Mean-Square Error To find the Root Mean Square Error (RMSE): If more than one data measurement run is displayed, first select a measurement run: 1. Optional: select a different data run. In the display legend, a red outline surrounds the run that is selected for operation. Complete these steps to change which run is selected: i. Click the legend. The legend enlarges. ii.
7 Data analysis Viewing Statistics in a bar graph SPARKvue® The Select Desired Curve Fit screen displays. 5. Click a curve fit option, and click OK. The statistics appear on the line graph and the Curve Fit button changes color. 6. To move the statistics box, drag it. 7. To remove the statistics box, click the orange Curve Fit button. The statistics are removed from the line graph.
7 Data analysis Viewing statistics in a table SPARKvue® i. Click the legend. The legend enlarges. ii. In the legend, click the symbol (but not the check box) of the run that you want to select. The red outline moves to the selected run. Sample Legend Note: When you apply statistics, such as mean or standard deviation, they are applied to the selected run. 2. Click the Bar Graph Tools button to open the tool palette. 3. Click the Statistics button to open the Statistics screen. 4.
7 Data analysis Viewing statistics in a table SPARKvue® 1. Optional: select a different data run. In the display legend, a red outline surrounds the run that is selected for operation. Complete these steps to change which run is selected: i. Click the legend. The legend enlarges. ii. In the legend, click the symbol (but not the check box) of the run that you want to select. The red outline moves to the selected run.
7 Data analysis Viewing statistics in a digits display SPARKvue® 7. Click the Statistics button to remove the statistics. Viewing statistics in a digits display To see the minimum, maximum, mean, standard deviation, or count of a data run: 1. Optional: select a different data run. In the display legend, a red outline surrounds the run that is selected for operation. Complete these steps to change which run is selected: i. Click the legend. The legend enlarges. ii.
7 Data analysis Viewing statistics in a meter SPARKvue® 4. Click one of the statistics to select it. 5. Click OK. The selected statistic appears in the digits display (instead of the most recently collected value). 6. Click the Statistics button to return the digits display to most recent data. Viewing statistics in a meter To see the minimum, maximum, mean, standard deviation, or count of a data run: 1. Optional: select a different data run.
7 Data analysis Viewing statistics in a meter SPARKvue® 3. Click the Statistics button to open the Statistics screen. 4. Click one of the statistics to select it. 5. Click OK. The selected statistic appears in the digits display (instead of the most recently collected value). 6. Click the Statistics button to return the digits display to most recent data.
8 Calculations and manually entered data Working with calculations SPARKvue® 8 Calculations and manually entered data n "Working with calculations": 88 n "Entering data manually": 90 Working with calculations 1. "Opening the calculator screen": 88 2. "Creating a calculation": 88 3. "Displaying a calculation": 89 Opening the calculator screen 1. Click the Experiment Tools button. The Experiment Tools screen opens. 2. Click Calculated Data. The calculator screen opens.
8 Calculations and manually entered data Working with calculations SPARKvue® Select functions Click Math, Trigonometry, Statistics, Special 1, Special 2 to change function types as needed as you build the expression. Select DEGor RAD Click RAD or DEG to indicate how angles are measured for the Trigonometry functions.. Add text and numbers Use the keyboard for text and numbers. Numbers can also be entered using the Math function. Use Greek letters Click the αβγ button.
8 Calculations and manually entered data Entering data manually SPARKvue® Entering data manually 1. Open the measurements list in the Page-build screen or the Table Properties screen. See "Opening the measurements list": 90 2. Create a empty data set for number or text data entry. See "Creating a data set for manual entry": 91 3. Prepare a table for data entry. See "Preparing a table for manual data entry": 91 4. Enter data in the table. See "Entering data into a manual data set": 92 5.
8 Calculations and manually entered data Preparing a table for manual data entry SPARKvue® View the available User-entered Data 1. Click the Home button. 2. Click the User-entered tab. The User-entered data sets are listed under: l User-entered Number Data l User-entered Text Data Creating a data set for manual entry Complete one of the following tasks.
8 Calculations and manually entered data Entering data into a manual data set SPARKvue® 4. Click OK. A new table appears displaying the empty data set ready for data entry. 5. Enter data. See "Entering data into a manual data set": 92. Entering data into a manual data set After creating a data set (see "Creating a data set for manual entry": 91), complete these steps to enter data: 1. Click the Table Tools button to open the tool palette. 2. Click the column header for the User-defined data. 3.
8 Calculations and manually entered data Editing manually entered data SPARKvue® Editing manually entered data Enter User-defined Data 1. Optional: create a new table. a. Click the New Page button. The build a new page screen opens. b. Click the New Page button. c. Click the New Page button. A table is added to the page. 2. Click the Select Measurement button. The Table Properties opens. 3. Click the Measurement box. 4. Click User-entered. 5. Click Create Data Set. 6. Enter a Measurement Name:. 7.
9 Building SPARKlab pages Starting a new SPARKlab page SPARKvue® 9 Building SPARKlab pages n "Starting a new SPARKlab page": 94 n "About adding elements to a SPARKlab page": 95 n "Removing or replacing an image or media file": 95 n "Adding a background image": 96 n "Deleting a SPARKlab page": 96 Starting a new SPARKlab page A. From the Home screen create a new SPARKlab: Touch Build. Continue to step 1. B. Within a SPARKlab add a new page: Touch the New Page button. Continue to step 1. 1.
9 Building SPARKlab pages About adding elements to a SPARKlab page SPARKvue® Line Graph Digits Table Bar Graph Meter Camera Media Text Assessment 3. For Text Boxes: Type in text into the Text Box. 4. For Cameras: Touch the Image Tools button. See Capturing a camera image. 5. For other data displays: Select the data for each display on the page. a. Touch the display data label(s), for example: Select Measurement, X-Axis Variable, Y-Axis Variable, Select a Media File, Add an Assessment or b.
9 Building SPARKlab pages Adding a background image SPARKvue® l Click the Remove button to delete the image. l Click the Load button to load a new image file. Adding a background image A background image fills the entire SPARKlab page. Elements on the page (data displays, text boxes, and image boxes) are overlaid in front of the background image. The background image is copied from a saved image file. You can use an image of any size; SPARKvue will re-size and stretch it to fit the page.
SPARKvue® 9 Building SPARKlab pages Deleting a SPARKlab page Document Number: 012-11074D 97
10 Saving and sharing Saving a SPARKlab (Locally and Online) SPARKvue® 10 Saving and sharing n "Saving a SPARKlab (Locally and Online)": 98 n "Printing a lab": 99 n "Exporting data": 99 n "Opening a saved lab": 100 n "Using Online Storage Services": 100 Saving a SPARKlab (Locally and Online) To save your work locally: 1. Click the Sharing button to open the Sharing screen. 2. Click Save File As. The Save window opens. 3.
10 Saving and sharing Printing a lab SPARKvue® Printing a lab The SPARKlab cannot be printed directly; however, you can capture SPARKlab pages in the journal and print the journal Complete these steps to take snapshots of SPARKlab pages and print the snapshots: 1. On each SPARKlab page that you wish to print, click the Snapshot button. 2. Each time you click the Snapshot button, the Snapshot Quick View appears briefly and an image of the page is added to the journal. 3. Click the Journal tab. 4.
10 Saving and sharing Opening a saved lab SPARKvue® Opening a saved lab 1. Click the Home button to return to the Home screen. 2. In the Home screen, click Saved Work. 3. Click the file. 4. Click Open. The lab opens. Using Online Storage Services The Online Storage Services function allows access to several services such as Google Drive, Box, Dropbox, Evernote, FTP, and WebDAV.
10 Saving and sharing Using Online Storage Services SPARKvue® Open a file from Online Storage Services 1. Click the Home button to return to the Home screen. 2. Click Online Storage Services on the Home page. The Online Storage Services dialog opens. 3. Select the service you would like to use and follow the instructions for the service. Note: Depending on your security settings, you may have to click Allow to complete the Online Storage Services sign-in process.
11 Keeping a journal Taking a snapshot SPARKvue® 11 Keeping a journal The journal allows you to keep a record of your work in a series of pictures and captions as your science investigation progresses. These steps outline the process of keeping a journal. See the following tasks for detailed instructions. 1. Take a snapshot. An image of the SPARKlab page is recorded. 2. Optionally, add a caption to the snapshot. 3. Repeat the previous steps at anytime during your science investigation. 4.
11 Keeping a journal Adding a caption to a snapshot or editing an existing caption SPARKvue® Adding a caption to a snapshot or editing an existing caption 1. Click the Journal button. 2. Click the Name box and enter or edit the caption name. 3. Click the Notes box and enter or edit the notes. 4. Click OK. Navigating in the journal 1. In the journal, click a thumbnail on the right side of the screen to view a journal entry. 2. Drag up or down to scroll through the thumbnails.
11 Keeping a journal Saving a journal SPARKvue® Saving a journal Do one of the following to save a journal: l Save the entire lab. See "Saving a SPARKlab (Locally and Online)": 98. The journal is saved as part of the lab. l Export the journal. The journal is saved in format that can be viewed in a web browser. Printing a journal 1. If you are currently viewing the journal, click Done to return to the SPARKlab. 2. Click the Sharing button to open the Sharing screen. 3. Click the Journal tab. 4.
12 Common tasks Turning pages SPARKvue® 12 Common tasks n "Turning pages": 105 n "Returning to the Home screen": 105 n "Entering symbols and Greek letters": 105 n "Opening the About SPARKvue screen": 106 n "Setting the language": 106 Turning pages l l Click the arrows of the Page Navigator to turn to the next page or previous page. Click the center of the Page Navigator to open a menu from which you can select any page in the SPARKlab.
12 Common tasks Opening the About SPARKvue screen SPARKvue® l l Click caps or shift to switch between lowercase and uppercase Greek letters. To enter subscript and superscript numbers, use the number keys on the Greek keyboard. l Click caps or shift to switch between subscript and superscript. l When you have finished entering symbols or Greek letters, click done. Opening the About SPARKvue screen 1. Click the About SPARKvue button to open the About SPARKvue screen. 2.