
User's Manual
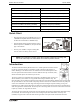
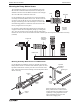
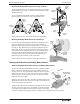
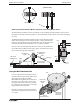
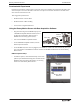
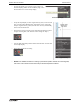
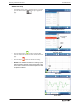
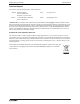
Table Of Contents
®
Model No.PS-2120A Introduction
7
• Set up a data display. For example, drag the Graph icon
from the Displays palette onto the workbook page, or dou-
ble-click the icon to create a Graph display..
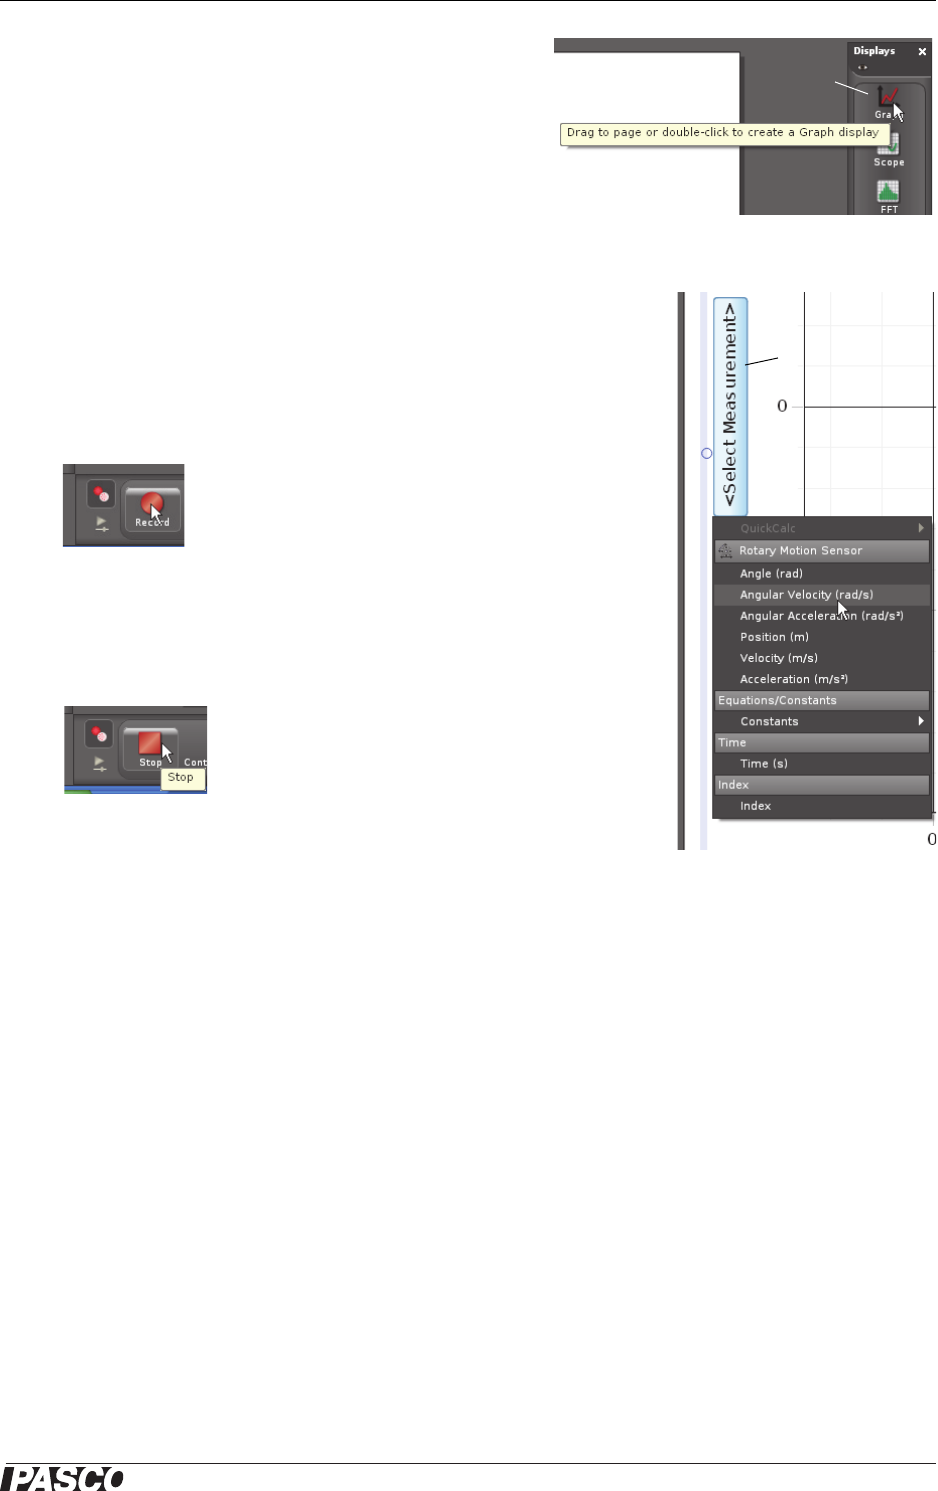
• Set up the Graph display to show Angular Velocity (rad/s) on the vertical
axis. Click the “Select Measurement” menu button on the vertical axis
and pick Angular Velocity (rad/s) from the menu. Time (s) automatically
shows on the horizontal axis.
• Click ‘Record’ in the lower left corner of the PASCO Capstone window
to begin recording data. (The “Record” button changes to “Stop”.)
• Turn the shaft of the Rotary Motion Sensor back-and-forth. View the data
in the Graph display.
• Click “Stop” to end data recording.
• SETUP: For detailed information on setting up the data acquisition software and recording data,
refer to the User’s Guide and the online help for the data acquisition software.
Create a Graph display
Graph display
icon
Click the “Select
Measurement”
menu button
Select “Angular Velocity”
Click “Record”
Click “Stop”