
User's Manual


®
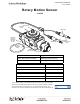
Model No.CI-6538 Introduction
9
012-13990A
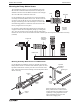
• Select the “Linear Accessory” you are using from the list
of choices in the menu, and click “OK”. NOTE: See the
experiment for information about which choice to select.
PASCO Capstone Display Setup
• Set up a data display. For example, drag the Graph icon
from the Displays palette onto the workbook page, or dou-
ble-click the icon to create a Graph display..
• Set up the Graph display to show Angular Velocity (rad/s) on the vertical
axis. Click the “Select Measurement” menu button on the vertical axis
and pick Angular Velocity (rad/s) from the menu. Time (s) automatically
shows on the horizontal axis.
PASCO Capstone Data Collection
• Click ‘Record’ in the lower left corner of the PASCO Capstone window
to begin recording data. (The “Record” button changes to “Stop”.)
• Turn the shaft of the Rotary Motion Sensor back-and-forth. View the data
in the Graph display.
• Click “Stop” to end data recording.
.
Select “Linear Accessory”
Create a Graph display
Graph display
icon
Click the “Select
Measurement”
menu button
Select “Angular Velocity”
Click “Record”
Click “Stop”
• SETUP: For more information on setting up the data acquisition software and recording data,
refer to the Online Help System and the User’s Guide for the data acquisition software.