
User's Manual


11
012-04695D Thermal Radiation System
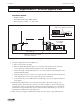
Calculations
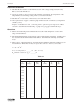
① For each value of X, calculate 1/X
2
. Enter your results in Table 2.2.
② Subtract the Average Ambient Radiation Level from each of your Rad measurements in
Table 2.2. Enter your results in the table.
③ On a separate sheet of paper, make a graph of Radiation Level versus Distance from Source,
using columns one and four from Table 2.2. Let the radiation level be the dependent (y) axis.
④ If your graph from part 3 is not linear, make a graph of Radiation Level versus 1/X
2
, using
columns three and four from table 2.2.
Questions
① Which of the two graphs is more linear? Is it linear over the entire range of measurements?
② The inverse square law states that the radiant energy per unit area emitted by a point source
of radiation decreases as the square of the distance from the source to the point of detection.
Does your data support this assertion?
③ Is the Stefan-Boltzmann Lamp truly a point source of radiation? If not, how might this
affect your results? Do you see such an effect in the data you have taken?