
User's Manual


®
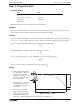
Model No. ME-6830 Exp. 4: Projectile Path
012-05375C 25
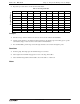
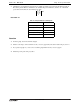
7. Calculate the percent difference between the two initial speeds that were found using the different methods.
Record the percent difference in Table 4.2. (To calculate the percent difference, let A be one of the initial
speed values and let B be the other initial speed value.)
Data Table 4.2
Question
1. From the graph, was the best-fit line straight?
2. What does the shape of the best-fit line on the y versus x
2
graph tell you about the relationship of y and x
2
?
3. If you plotted a graph of y versus x, how would the graph differ from the y versus x
2
graph?
4. What shape is the path of the projectile?
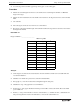
Table 4.2: Compare Methods for Initial Speed
Item Value
Slope of graph
Initial speed from slope
Time of flight
Initial speed from x,y
Percent difference
AB–
AB+
2
-------------
-------------------
x100