
User's Manual


90
AC/DC Electronics Laboratory 012-05892A
®
➄ Click the “OFF” button ( ) in the Signal Generator window.
➅ Turn off the power switch on the back of the power amplifier. Turn off the DC power supply.
ANALYZING THE DATA
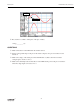
➀ Click on the Graph to make it active. Select “Save As…” from the File menu to save your data.
➁ Click the “Autoscale” button ( ) to rescale the Graph to fit the data.
• Optional: If a printer is available, select “Print Active Display” from the File menu.
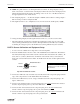
➂ Click the “Smart Cursor” button. The cursor changes to a cross-hair when you move it into the
display area.
• The X-coordinate of the cursor/cross-hair is displayed under the horizontal axis. The Y-coordinate
of the cursor/cross-hair is displayed next to the vertical axis.
➃ Put the cursor at the point on the plot of Vcollector where the voltage first begins to increase
above zero. Hold down the Shift key.
Smart Cursor
➄ While holding the Shift key, move the cursor/cross-hair vertically along the dashed line until you
reach the point on the plot of Vbase that corresponds to the same point on the plot of Vcollector.