
User's Manual


77
012-05892A AC/DC Electronics Laboratory
®
12
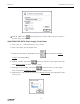
Click the “OFF” button ( ) in the Signal Generator window. Turn off the power switch on
the back of the power amplifier.
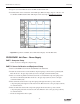
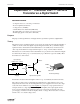
ANALYZING THE DATA: Power Supply, Single Diode
➀ Select “Save As…” from the File menu to save your data.
➁ Select “New Graph” from the Display menu.
➂ Change the input. Click the “Input Menu” button ( ). Select “Data Cache, Rectified
Voltage” from the Input Menu.
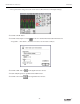
➃ Click the “Add Plot” menu button ( ) at the lower left corner of the Graph. Select “Data
Cache,
Filtered Voltage” from the “Add Plot” menu.
➄ Click again on the “Add Plot” menu button ( ) at the lower left corner of the Graph.
Select “Data Cache,
Load Resistor Voltage” from the “Add Plot” menu.
➅ Click anywhere on the vertical axis of the top plot (Rectified Voltage). The “Enter Plot Y Scale”
window opens.