
User's Manual


63
012-05892A AC/DC Electronics Laboratory
®
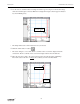
➃ Click the “Magnifier” button ( ). The cursor changes to a magnifying glass shape.
➄ Use the cursor to click-and-draw a rectangle around the region of the plot of current and voltage
where the current begins to increase. Make the rectangle tall enough so that its upper boundary is
beyond 2 milliamp (mA).
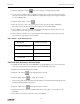
➅ Click the “Smart Cursor” button ( ).
➆ Move the cursor/cross-hair to the point on the plot where the current reaches 2 milliamps.
Record the value of the turn-on
voltage (X-coordinate) at 2 mA in Data Table 1.
➇ Select “Run #3” from the bottom of the Experiment menu. Repeat the analysis process for the
plot of Current versus Voltage for the second LED.
➈ Select “Run #4” from the bottom of the Experiment menu. Repeat the analysis process for the
plot of Current versus Voltage for the last LED.
DATA TABLE 1: Light-Emitting Diodes
Description Voltage (V) at 2 mA
1. Diode & 1 kΩ resistor
2. Red LED
3. Yellow LED
4. Green LED
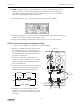
PART IIIB: Data Recording - Bi-Color Diode
➀ Carefully bend the wire leads of the CLEAR (bicolor) light-emitting diode so they can fit in the
component springs in place of the last diode you used in Part IIIA of this Unit.
➁ Replace the green LED with the bicolor LED.
➂ Click the “ON” button ( ) in the Signal Generator window.
➃ Click the “REC” button ( ) to begin data recording.
• Data recording will end automatically after 250 samples are measured. Run #5 will appear in the
Data list in the Experiment Setup window.
➄ Click the “OFF” button ( ) in the Signal Generator window.
➅ Describe the behavior of the bicolor LED during data recording. Put your observations in the
Data Table
➆ Turn off the power switch on the back of the power amplifier.