
User's Manual


61
012-05892A AC/DC Electronics Laboratory
®
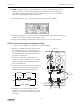
➃ Use the cursor to click-and-draw a rectangle around the region of the plot of current and voltage
where the current begins to increase. Make the rectangle tall enough so that its upper boundary is
beyond 2 milliamp (mA).
Click-and-draw rectangle
around region of interest
• The Graph will rescale to fit the data in the area you selected.
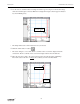
➄ Click the “Smart Cursor” button ( ).
• The cursor changes to a cross-hair. The Y-coordinate of the cross-hair is displayed near the
vertical axis. The X-coordinate of the cross-hair is displayed below the horizontal axis.
➅ Move the cursor/cross-hair to the point on the plot where the current reaches 2 milliamps.
Record the value of the turn-on
voltage (X-coordinate) at 2 mA in the Data Table.
Smart Cursor at 2 mA
X-coordinate,
turn-on voltage