
User's Manual


47
012-05892A AC/DC Electronics Laboratory
®
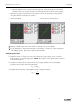
➀ Click the “Smart Cursor” button ( ) in the Scope. The cursor changes to a cross-hair. Move
the cursor into the display area of the Scope.
• The Y-coordinate of the cursor/cross-hair is shown next to the Vertical Axis.
• The X-coordinate of the cursor/cross-hair is shown next to the Horizontal Axis.
➁ Move the cursor/cross-hair to the top of the exponential part of the curve when the plot of
voltage across the resistor (Analog Channel B) is at its maximum. Record the peak voltage (Y-
coordinate) and the time (X-coordinate) for that point in the Data Table. Determine the voltage
that is half of the peak (the half-max voltage).
X-coordinate
Y-coordinate
Smart
Cursor
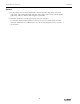
➂ Move the cursor down the exponential part of the plot of resistor voltage until half the maximum
(peak) voltage is reached. Record the X-coordinate (time) for this point.
X-coordinate
Smart
Cursor