
User`s guide


Managing Services and Processes 129
Viewing Active Processes and Services
The vzps utility provides certain additional functionality related to monitoring separate
Containers running on the Parallels server. For example, you can use the -E switch with the
vzps utility to:
display the Container IDs where the processes are running
view the processes running inside a particular Container
vzps prints the information about active processes on your Parallels server. When run without
any options, vzps lists only those processes that are running on the current terminal. Below is
an example output of the vzps run:
$ vzps
PID TTY TIME CMD
4684 pts/1 00:00:00 bash
27107 pts/1 00:00:00 vzps
Currently, the only processes assigned to the user/terminal are the bash shell and the vzps
command itself. In the output, the PID (Process ID), TTY, TIME, and CMD fields are
contained. TTY denotes which terminal the process is running on, TIME shows how much CPU
time the process has used, and CMD is the name of the command that started the process.
Note: The IDs of the processes running inside Containers and displayed by running the vzps
command on the Parallels server does not coincide with the IDs of the same processes shown by
running the ps command inside these Containers.
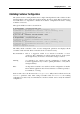
As you can see, the standard vzps command just lists the basics. To get more details about the
processes running on your server, you will need to pass some command line arguments to
vzps. For example, using the aux arguments with this command displays processes started by
other users (a), processes with no terminal or one different from yours (x), the user who started
the process and when it began (u). Besides, you can pass vzps the -E switch to sort the
processes by the Container IDs where they are running.
# vzps aux -E
USER PID %CPU %MEM VSZ RSS TTY STAT START TIME COMMAND
root 1 0.0 0.0 1516 128 ? S Jul14 0:37 init
root 5 0.0 0.0 0 0 ? S Jul14 0:03 [ubstatd]
root 6 0.0 0.0 0 0 ? S Jul14 3:20 [kswapd]
#27 7 0.0 0.0 0 0 ? S Jul14 0:00 [bdflush]
root 9 0.0 0.0 0 0 ? S Jul14 0:00 [kinoded]
root 1574 0.0 0.1 218 140 pts/4 S 09:30 0:00 -bash
There is a lot more information now. The fields USER, %CPU, %MEM, VSZ, RSS, STAT, and
START have been added. Let us take a quick look at what they tell us.
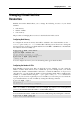
The USER field shows you which user initiated the command. Many processes begin at system
start time and often list root or some system account as the USER. Other processes are, of
course, run by individuals.
The %CPU, %MEM, VSZ, and RSS fields all deal with system resources. First, you can see
what percentage of the CPU the process is currently utilizing. Along with CPU utilization, you
can see the current memory utilization and its VSZ (virtual memory size) and RSS (resident set
size). VSZ is the amount of memory the program would take up if it were all in memory; RSS is
the actual amount currently in memory. Knowing how much a process is currently eating will
help determine if it is acting normally or has spun out of control.