
User`s guide

Managing Physical Servers 29
Monitoring Physical Server
Resources
Parallels Virtual Automation enables you to monitor and manage not only the virtual
environments operation, but also the physical servers resources. In Parallels Virtual
Automation, you can view the current resource usage statistics and adjust the values to
improve the performance of the physical server, as well as that of the virtual
environments it hosts.
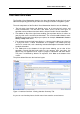
The overall CPU, disk and memory-related resources usage of the physical server
registered in Parallels Virtual Automation are displayed on the physical server
Dashboard.
The Disk Partitions and Memory sections inform you about the respective resources
consumption on the physical server.
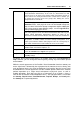
The information on the Disk Partitions size usage in all the host OS partitions or logical
disks existing on your physical server is presented in the following tables
(corresponding to the number of partitions/logical disks):
Column Name Description
Mount Point The name of the partition/logical disk using the resource.
Used Used amount of disk size in the partition/logical disk
Free Free amount of disk size in the partition/logical disk.
Total The total amount of disk size allocated for the partition/logical
disk.
The information on the Memory usage is displayed in the following way:
Field Description
Physical memory The percentage of the current physical server utilization in terms
of allocated memory.
Swap Space The percentage of the current physical server utilization in terms
of allocated swap space. The bar is not displayed if swapping is
not configured on the physical server.
RAM+Swap The simple average of the resources above.