
User's Manual
NGxx User Manual
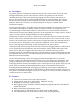
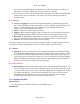
uses a device grid that displays all claimed devices in the current folder. Each device is
displayed in its own box and lists any sensors on the device. (image)
● Note that for Nx devices with attached DBx devices attached, the name of the added DBx
(along with the port it is attached to and a table of its sensors) will appear below the
onboard sensors.
0.8.2 Logging
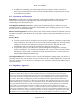
● Managing Logging data can be done through Data Reorder. To manage logging (start,
stop, edit) for multiple devices simultaneously, click the "Manage Logging" option in the
navbar. A table containing all sensors within the current working folder will be
displayed. The following fields are available:
● Sensor - Displays the sensor name (read-only).
● Logging - When checked, logging is either currently active or will be started once saved.
When unchecked, logging is either currently inactive or will be stopped when saved.
● Resolution - Logging data is compressed to save space. A larger data resolution will
allow you to store more data, however the recorded data will have a lower precision.
● Interval - The amount of time between sensor readings.
Click Save changes when you have changed the logging settings. All logging changes will now
be saved to the sensors (this may take some time if many changes have been made).
0.9 Alarms
● Alarms can be set for onboard sensors or any Paragon Robotics external sensors. While
in the grid view of Data Recorder, navigate to the settings of the specific sensor you wish
to set an alarm for. This settings option can be opened by clicking the "pencil" logo next
to the sensor itself. From here the "Alarms" tab can be accessed and you can add multiple
alarms with different conditions if needed. Alerts for these alarms can also be added so a
notification can be sent via email or text message (sms).
0.9.1 Data Analyzer
● Data Analyzer is used to chart and view data. When you first launch Data Analyzer, you
will see an empty chart. The first step to adding a series is to click either Add series or the
"+" button on the left side of the screen. Note that logging must be enabled for the sensor
you wish to view data for. You will next be prompted with a device selector and will
now display any claimed devices. You may choose any of these that have logging
enabled. Click Select after you have chosen one or more sensors.
0.10 Expansion Modules
Built in sensors
● All gateways have built in temperature and humidity sensors
DB Modules
Page 9 of 11