
Server User Manual
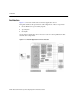
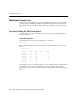

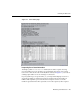

Table Of Contents
- Oracle HTTP Server powered by Apache Performance Guide
- Send Us Your Comments
- Preface
- 1 Performance Overview
- 2 Monitoring Your Web Server
- 3 Sizing and Configuration
- 4 Optimizing HTTP Server Performance
- 5 Optimizing Apache JServ
- Index
Monitoring the Web Server
Monitoring Your Web Server 2-5
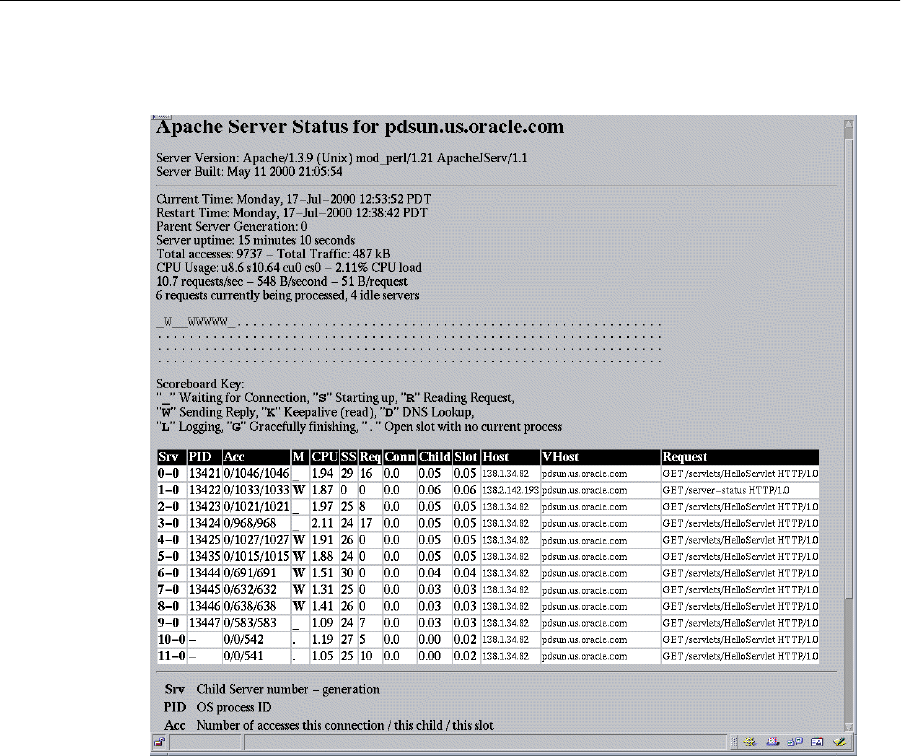
Figure 2–1 Server status page
Interpreting Server Status Information
The display (with ExtendedStatus enabled) shows that 6 requests are being
processed and four servers are idle. You can determine what stage of processing
each server is in from the value in the M (Mode column). In Figure 2–1, 6 servers are
sending replies and 4 servers are waiting for connections.
If your system has poor response times, or you suspect that httpd processes have
stopped responding, look at the Req (request) column. It shows the number of
milliseconds required to process the most recent request. Check to see if this
number is greater than the time expected to service the request. If, after a request