
Calc Guide

Appearance
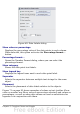
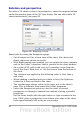
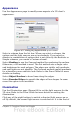
Use the Appearance page to modify some aspects of a 3D chart’s
appearance.
Figure 65: Modifying appearance of 3D chart
Select a scheme from the list box. When you select a scheme, the
options and the light sources are set accordingly. If you select or
deselect a combination of options that is not given by the Realistic or
Simple schemes, you create a Custom scheme.
Select Shading to use the Gouraud method for rendering the surface.
Otherwise, a flat method is used. The flat method sets a single color
and brightness for each polygon. The edges are visible, soft gradients
and spot lights are not possible. The Gouraud method applies gradients
for a smoother, more realistic look. Refer to the Draw Guide for more
details on shading.
Select Object Borders to draw lines along the edges.
Select Rounded Edges to smooth the edges of box shapes. In some
cases this option is not available.
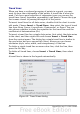
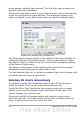
Illumination
Use the Illumination page (Figure 66) to set the light sources for the
3D view. Refer to the Draw Guide for more details on setting the
illumination.
Click any of the eight buttons to switch a directed light source on or
off. By default, the second light source is switched on. It is the first of
Chapter 3 Creating Charts and Graphs 89