
Calc Guide
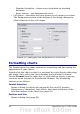
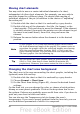
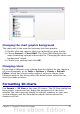
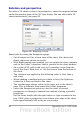
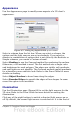
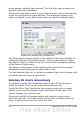

Figure 63: Chart Area dialog
Changing the chart graphic background
The chart wall is the area that contains the chart graphic.
1) Double-click the chart so that it is enclosed by a gray border.
2) Choose Format > Chart Wall. The Chart Wall dialog has the
same formatting options as described in “Changing the chart area
background” above.
3) Choose your settings and click OK.
Changing colors
If you need a different color scheme from the default for the charts in
all your documents, go to Tools > Options > Charts > Default
Colors, which has a much wider range of colors to choose from.
Changes made in this dialog affect the default chart colors for any
chart you make in future.
Formatting 3D charts
Use Format > 3D View to fine tune 3D charts. The 3D View dialog has
three pages, where you can change the perspective of the chart,
whether the chart uses the simple or realistic schemes, or your own
custom scheme, and the illumination which controls where the
shadows will fall.
Chapter 3 Creating Charts and Graphs 87