
Calc Guide
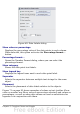

Arrangement
Provides two choices: Bring Forward and Send Backward, of
which only one may be active for some items. Use these choices to
arrange overlapping data series.
Title
Formats the titles of the chart and its axes.
Legend
Formats the location, borders, background, and type of the legend.
Axis
Formats the lines that create the chart as well as the font of the text
that appears on both the X and Y axes.
Grid
Formats the lines that create a grid for the chart.
Chart Wall, Chart Floor, Chart Area
Described in the following sections.
Chart Type
Changes what kind of chart is displayed and whether it is two- or
three-dimensional.
Data Ranges
Explained on page 76 (Figure 55 and Figure 56).
3D View
Formats 3D charts (see page 87).
Note
Chart Floor and 3D View are only available for a 3D chart.
These options are unavailable (grayed out) if a 2D chart is
selected.
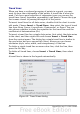
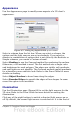
In most cases you need to select the exact element you want to format.
Sometimes this can be tricky to do with the mouse, if the chart has
many elements, especially if some of them are small or overlapping. If
you have Tooltips turned on (in Tools > Options > OpenOffice.org >
General > Help, select Tips), then as you move the mouse over each
element, its name appears in the Tooltip. Once you have selected one
element, you can press Tab to move through the other elements until
you find the one you want. The name of the selected element appears
in the Status Bar.
Chapter 3 Creating Charts and Graphs 85