
Calc Guide
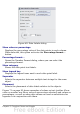
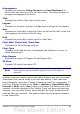
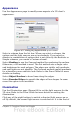

– Standard deviation – shows error calculated on standard
deviation
– Error margin – you designate the error
• Cell range – calculates the error based on cell ranges you select.
The Parameters section at the bottom of the dialog changes to
allow selection of the cell ranges.
Figure 62: Specifying the parameters of error bars
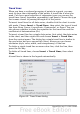
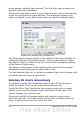
Formatting charts
The Format menu has many options for formatting and fine-tuning the
appearance of your charts.
Double-click the chart so that it is enclosed by a gray border indicating
edit mode; then, select the chart element that you want to format.
Choose Format from the menu bar, or right-click to display a pop-up
(context) menu relevant to the selected element. The formatting
choices are as follows.
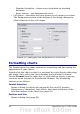
Format Selection
Opens a dialog in which you can specify the area fill, borders,
transparency, characters, font effects, and other attributes of the
selected element of the chart (see page 91).
Position and Size
Opens a dialog (see page 94).
84 OpenOffice.org 3.x Calc Guide