
Calc Guide
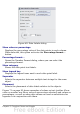
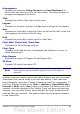
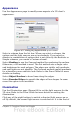

Figure 60: Data Labels dialog
Show value as percentage
Displays the percentage value of the data points in each column.
When selected, this option activates the Percentage format...
button.
Percentage format...
Opens the Number Format dialog, where you can select the
percentage format.
Show category
Shows the data point text labels.
Show legend key
Displays the legend icons next to each data point label.
Separator
Selects the separator between multiple text strings for the same
object.
Placement
Selects the placement of data labels relative to the objects.
Figure 71 on page 95 shows examples of values as text (neither Show
value as number nor Show value as percentage selected) and values as
percentages, as well as when data values are used as substitutes for
legends or in conjunction with them.
Chapter 3 Creating Charts and Graphs 81