
Calc Guide
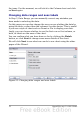

Changing the chart type
You can change the chart type at any time. To do so:
1) First select the chart by double-clicking on it. The chart should
now be surrounded by a gray border.
2) Then do one of the following:
• Choose Format > Chart Type from the menu bar.
• Click the chart type icon on the Formatting toolbar.
• Right-click on the chart and choose Chart Type.
In each case, a dialog similar to the one in Figure 54 opens. See page
75 for more information.
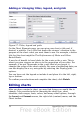
Adding or removing chart elements
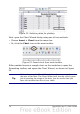
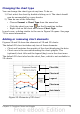
Figures 58 and 59 show the elements of 2D and 3D charts.
The default 2D chart includes only two of those elements:
• Chart wall contains the graphic of the chart displaying the data.
• Chart area is the area surrounding the chart graphic. The
(optional) chart title and the legend (key) are in the chart area.
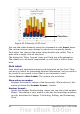
The default 3D chart also has the chart floor, which is not available in
2D charts.
Figure 58: Elements of 2D chart
Chapter 3 Creating Charts and Graphs 79
Chart area
Chart wall
Chart title
Legend
Axis labels