
Calc Guide
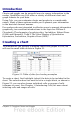
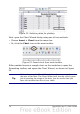
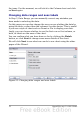
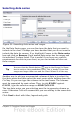
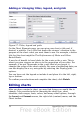
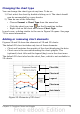
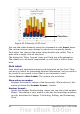

Figure 52: Selecting data for plotting
Next, open the Chart Wizard dialog using one of two methods.
• Choose Insert > Chart from the menu bar.
• Or, click the Chart icon on the main toolbar.
Figure 53: Insert chart from main toolbar
Either method inserts a sample chart on the worksheet, opens the
Formatting toolbar, and opens the Chart Wizard, as shown in Figure
54.
Tip
Before choosing the Chart Wizard, place the cursor anywhere in
the area of the data. The Chart Wizard will then do a fairly good
job of guessing the range of the data. Just be careful that you
have not included the title of your chart.
74 OpenOffice.org 3.x Calc Guide