
Calc Guide

2) You have added or deleted data sets in the original list.
In this case the change means that the DataPilot has to use a
different area of the spreadsheet for its analysis. A change of the
data reference for an existing DataPilot is not possible. You must
redo the DataPilot.
Cell formatting
The cells in the results area of the DataPilot are automatically
formatted in a simple format by Calc. You can change this formatting
using all the tools in Calc, but please note that if you make any change
in the design of the DataPilot or any updates, the formatting will return
to the that applied automatically by Calc.
For the number format in the data field, Calc uses the number format
that is used in the corresponding cell in the source list. In most cases,
this is useful (for example, if the values are in the currency format,
then the corresponding cell in the result area is also formatted as
currency). However, if the result is a fraction or a percentage, the
DataPilot does not recognize that this might be a problem; such results
must either be without a unit or be displayed as a percentage.
Although you can correct the number format manually, the correction
stays only until the next update.
Multiple data fields
Until now we have assumed that the layout of the DataPilot contains
only one data field. However, it is possible to have several data fields in
the middle of the layout. This makes summaries and analyses of
multiple aspects possible.
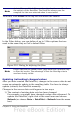
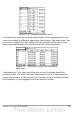
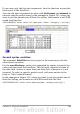
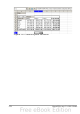
You could, for example, list all the sales values per day and additionally
give the number of entries per day. To do this, put both the sales field
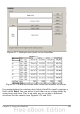
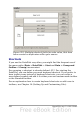
and the date field into the Data Fields area. For the date field, select
the Count-date option for the aggregate function (see Figure 172).
Since every entry has a specific date, this field will give you the
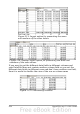
number of entries for each date. If you group the values per month,
you get an overview with the sales value and the number of closed
sales for each category and month (see Figure 170).
262 OpenOffice.org 3.x Calc Guide