
Calc Guide

Page fields
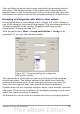
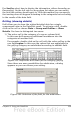
The preferences dialog for page fields is the same as for row and
column fields, even though it appears to be useless to do the same
settings as described for the row and column fields. With the flexible
use of the DataPilot you can often switch the use of the different fields
for pages, columns or rows. The fields keep the settings that you made
for them. For this, the page field has the same properties as a row or
column field. These settings only take effect when you use the field not
as page field but as row or column field.
Working with the results of the DataPilot
One very important feature is the flexibility of the DataPilot. An
analysis can be changed with only a few mouse clicks. Some functions
of the DataPilot can be used only with the results of an analysis.
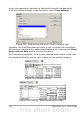
Start the dialog
Right-click in the area of the resulting table of the DataPilot and
choose Start toopen the DataPilot dialog with all current settings.
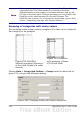
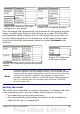
Change layout by using drag and drop
The easiest and fastest method to change the layout of the DataPilot is
drag and drop. Within the result table of the DataPilot, move one of the
page, column, or row fields to a different position (see “Examples with
step by step instructions” starting on page 219).
You can remove a column, row, or page field from the DataPilot by
clicking on and dragging it out of the DataPilot.
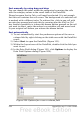
Grouping rows or columns
For many analyses or summaries, the categories have to be grouped.
You can merge the results in classes or periods. In the DataPilot you do
a grouping after you have first made an ungrouped DataPilot table.
You can access the grouping with the menu entry Data > Group and
Outline > Group or by pressing F12. It is important that you select
the correct cell area. The grouping function is mainly determined by
the type of values that have to be grouped. You need to distinguish if
you have scalar values, date or time values, or other values, such as
text, that you want grouped.
Chapter 8 Using the DataPilot 253