
Calc Guide


Rule
Calc lists must have the normal form; that is, they must have a
simple linear structure.
When entering the data, do not add outlines, groups, or summaries.
This becomes clear when we think about what we could have done
wrong in our Sales list example in the section “Examples with step by
step instructions” starting at page 219. Here are some mistakes
commonly made by inexperienced spreadsheet users:
1) You could have made several sheets, for example, a sheet for each
group of articles. Analyses are then possible only within each
group. Analyses for several groups would be a lot of work.
2) In the Sales list, instead of only one column for the amount, you
could have made a column for the amounts for each employee.
The amounts then had to be entered into the appropriate column.
An analysis with the DataPilot would not be possible any more. In
contrast, one result of the DataPilot is that you can get results for
each employee if you have entered everything in one column.
3) You could have entered the amounts in chronological order. At the
end of each month you could have made a sum total. In this case,
sorting the list for different criteria is not possible because the
DataPilot will treat the sum totals the same as any other figure.
Getting monthly results is one of the very fast and easy features
of the DataPilot.
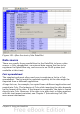
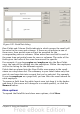
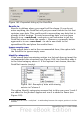
Start
Start the DataPilot with Data > DataPilot > Start. If the list to be
analyzed is in a spreadsheet table, select one cell within this list. Calc
recognizes and selects the list automatically for use with the DataPilot.
242 OpenOffice.org 3.x Calc Guide