
Calc Guide

3) In the DataPilot:
• Drag Time into the Row Fields area.
• Drag Date into the Data Fields area.
4) Click More to show more options in the lower part of the dialog.
5) Choose – new sheet – for Results to.
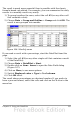
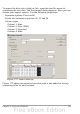
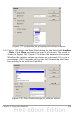
6) In this case we need to count the number of values, not their sum.
Double-click on Sum – Date to open the Data Field dialog and
select the function Count (see Figure 176).
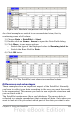
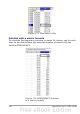
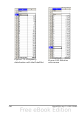
7) Click OK. As an intermediate result, you get a DataPilot table that
has for every time within the raw data a separate line.
Note
This may be a very time-consuming process because of the large
number of items. The time does not depend that much on the
number of lines but rather on the number of rows needed for the
table that contains the results.
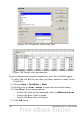
Figure 176: Properties of the data field
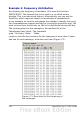
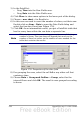
8) For grouping the rows, select the cell A4 or any other cell that
contains a time.
9) Choose Data > Group and Outline > Group, select for the
interval Hours and click OK. The result is now grouped according
to hours.
238 OpenOffice.org 3.x Calc Guide