
Calc Guide

Example 3: Frequency distribution
For showing the frequency of incidents, Calc uses the function
FREQUENCY. This formula has to be used in a so-called matrix
formula. This is an advanced feature. Alternatively you can use the
DataPilot, which requires almost no knowledge of spreadsheets.
In our example we want to investigate the number of emails that go to
the Germanophone support mailing list (users@de.openoffice.org). We
want to know how the activity on the list is distributed during the day.
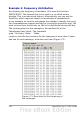
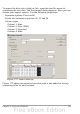
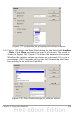
The starting point for this example is the mailbox file of the
Thunderbird mail client. The command
grep 'Delivery-Date:' Inbox
creates a text file that contains for the timespan of more than 2 years
one line for each message, with date and time (Figure 171).
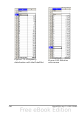
Figure 171: Raw data for the frequency of
the messages
234 OpenOffice.org 3.x Calc Guide