
Calc Guide
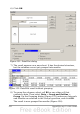
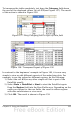
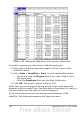
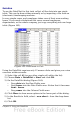

To transpose the table completely, just drag the Category field above
the area of the displayed values, to cell C3 (see Figure 157). The result
of this action is shown in Figure 158.
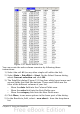
Figure 157: Drag Category field to right of Data field
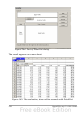
Figure 158: Transposed layout of Figure 156
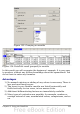
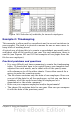
In contrast to the beginners’ example in Figure 149, it is now very
simple to view or add different aspects of the underlying data. For
example, to see the values for different regions, do the following:
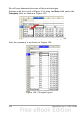
1) Select the cell A3 (or any other single cell that is part of the
DataPilot result).
2) Select Data > DataPilot > Start to start the DataPilot again.
Drag the Region field into the Row Fields area. Depending on the
order you choose for the row fields, the result is either regions
with date subdivisions or vice versa.
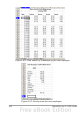
3) Click OK. The result is shown in Figure 159.
Chapter 8 Using the DataPilot 225