
Calc Guide


the connection between cells through formulas, for example addition
with the plus operator or the SUM function.
This small exercise might be useful for a first contact with the
program, but it shows only a very small fraction of the tasks in an
office. To create such a sales overview, you also need the original data.
That is, before you can use a spreadsheet for creating the sales
overview, you need to add many single purchases from different lists
and then enter the sums into the relevant cells C5 to F7.
Practical problems and questions
• For displaying additional values for May, June, July, and so on, you
need to add extra columns. This means that you have to change
the structure of the calculation sheet. This is not only somewhat
inefficient from a workflow point of view, it also adds some
practical questions: How do references react, if you add more
columns or rows to the sum formulas?
• The layout, where the timeline is displayed horizontally, might be
less convenient if you add more months. A vertical layout might
be a more efficient use of space. How can the table then be
transposed? Do you have to enter everything again?
• What if the management asks unexpected questions or adds an
additional subdivision for the different sales regions or a
constraint of the sales for a given employee. In these cases you
again have to manually add all the sums and create different
tables in many variations.
• Is it really acceptable and realistic to create such an overview by
adding the different values manually? This is really a lot of work
and extremely error-prone!
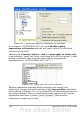
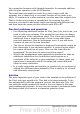
Solution
The most important part of your task in the example is the addition of
the Total sales per month cells. This had to be done manually. To do
this automatically with the program, just get the data into Calc. You
can enter the single numbers by hand or you can import a file from
your bookkeeping software. In any case we assume a continuous table
that keeps track of all sales in a somewhat primitive form.
220 OpenOffice.org 3.x Calc Guide