
Calc Guide

Graphics in Calc
Calc is often used to present data and make forecasts and predictions.
Graphics can turn an average document into a memorable one. Calc
can import various vector (line drawing) and raster (bitmap) file
formats. The most commonly used graphic formats are GIF, JPG, PNG,
and BMP. See the Help for a full list of the formats OOo can import.
Graphics in Calc are of three basic types:
• Image files, such as photos, drawings, and scanned images
• Diagrams created using OOo’s drawing tools
• Charts and graphs created using OOo’s Chart facility
This chapter covers images and diagrams. Charts are described in
Chapter 3 (Creating Charts and Graphs).
Although using graphics in Calc is very similar to using graphics in any
other component of OOo, this chapter explains some of the differences
in their use. It also covers some of the more advanced graphics
functions and how they can further enhance your spreadsheet.
Note
The term graphics refers to both pictures and drawing objects.
Often the word images is used when referring to pictures and
other graphics that are not drawing objects.
Adding graphics (images)
Images (also called pictures in OOo), such as corporate logos and
photographs of people and products, are probably the most common
types of graphics added to a Calc document. They may be downloaded
from the Internet, scanned, or created with a graphics program; or
they may be photos taken with a digital camera.
Images can be inserted in four ways:
• Using the Insert File dialog
• By dragging and dropping a supported file
• From the gallery
• From the clipboard by copying and pasting
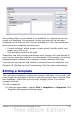
Inserting an image file
Perhaps the most common way to insert graphics is to use an existing
file.
130 OpenOffice.org 3.x Calc Guide