
Calc Guide
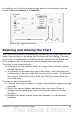
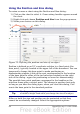
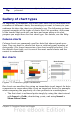
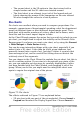
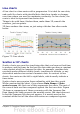
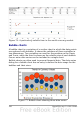

Figure 76: A particularly volatile time in the world currency market.
Bubble charts
A bubble chart is a variation of a scatter chart in which the data points
are replaced with bubbles. It shows the relations of three variables in
two dimensions. Two variables are used for the position on the X-axis
and Y-axis, while the third is shown as the relative size of each bubble.
One or more data series can be included in a single chart.
Bubble charts are often used to present financial data. The data series
dialog for a bubble chart has an entry to define the data range for the
bubbles and their sizes.
Figure 77: Bubble chart showing three data series
100 OpenOffice.org 3.x Calc Guide