
Operation Manual
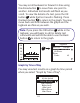
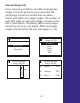
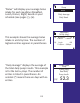

Results by time period are shown day by day, one
week at a time. Each time you reach the end of the
graph, it will move by one day. Weekends are noted
by a bold bar above the dates.
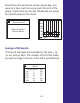
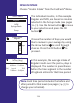
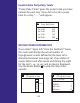
Average of All Results
Test result averages are available for the last 7, 14,
30, 60, and 90 days. The number of tests that make
up each average is shown on the left in parentheses.
113
15 0
50
200
250
300
100
Sep 21 Sep 28
Before Breakfast
Glucose Results
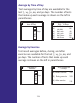
Graph daily results
by time period
Number of Days Avg
7
14
30
60
90
120
147
187
200
201
(33)
(75)
(153)
(202)
Average of all
Results
(18)