
Operation Manual

111
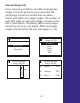
GLUCOSE ANALYSIS
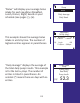
When you select “Glucose Analysis” on the
FastFacts
®
menu, an additional menu of choices
appears. Use the Arrow button to move to the
desired menu and press the OK button .
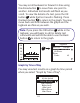
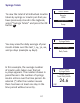
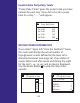
Interactive Graph of All Results
The interactive graph displays three days of test
results at a time with the most recent test result
flashing. A bold bar above the dates indicates a
weekend. The two dotted lines indicate the lowest
and highest values of your before- and after-meal
glucose ranges (see Advanced Feature Set-up, pages
72–76). If you have not selected an after-meal range,
only the before-meal range will appear. Results
above 300 mg/dL or below 50 mg/dL are indicated by
an arrow at the top or bottom edge of the graph.
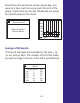
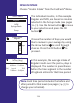
Glucose Analysis
Average by Time of Day
Graph of All Results
Graph by Time of Day
Glucose Range Info
Average of All Results
Average by Exercise
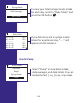
Graph shows all
results
Use arrows to scroll
OK for details
Interactive
Glucose Graph
Sep 22 Sep 23 Sep 24
15 0
50
200
250
300
100
OK