
Data Sheet

© 2007 Fairchild Semiconductor Corporation www.fairchildsemi.com
FSQ0365, FSQ0265, FSQ0165, FSQ321 • Rev. 1.0.6 10
FSQ0365/0265/0165/321 — Green Mode Fairchild Power Switch (FPS™) for Valley Switching Converter
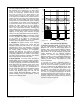
Typical Performance Characteristics (Continued)
Characteristic graphs are normalized at T
A
=25°C.
-25 0 25 50 75 100 125
0.0
0.2
0.4
0.6
0.8
1.0
1.2
Normalized
Temperature [°C]
-25 0 25 50 75 100 125
0.0
0.2
0.4
0.6
0.8
1.0
1.2
Normalized
Temperature [°C]
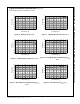
Figure 10. Blanking Time (t
B
) vs. T
A
Figure 11. Feedback Source Current (I
FB
) vs. T
A
-25 0 25 50 75 100 125
0.0
0.2
0.4
0.6
0.8
1.0
1.2
Normalized
Temperature [°C]
-25 0 25 50 75 100 125
0.0
0.2
0.4
0.6
0.8
1.0
1.2
Normalized
Temperature [°C]
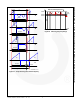
Figure 12. Shutdown Delay Current (I
DELAY
) vs. T
A
Figure 13. Burst Mode High Threshold Voltage (V
burh
)
vs. T
A
-25 0 25 50 75 100 125
0.0
0.2
0.4
0.6
0.8
1.0
1.2
Normalized
Temperature [°C]
-25 0 25 50 75 100 125
0.0
0.2
0.4
0.6
0.8
1.0
1.2
Normalized
Temperature [°C]
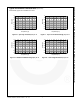
Figure 14. Burst Mode Low Threshold Voltage (V
burl
)
vs. T
A
Figure 15. Peak Current Limit (I
LIM
) vs. T
A