
Data Sheet


© 2009 Fairchild Semiconductor Corporation www.fairchildsemi.com
FSGM0765R • Rev. 1.0.2 7
FSGM0765R — Green-Mode Fairchild Power Switch (FPS™)
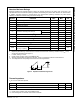
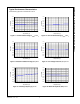
Typical Performance Characteristics
Characteristic graphs are normalized at T
A
=25°C.
0.80
0.85
0.90
0.95
1.00
1.05
1.10
1.15
1.20
-40℃ -25℃ 0℃ 25℃ 50℃ 75℃ 100℃ 125℃
Normalized
Temperature [°C]
0.80
0.85
0.90
0.95
1.00
1.05
1.10
1.15
1.20
-40℃ -25℃ 0℃ 25℃ 50℃ 75℃ 100℃ 125℃
Normalized
Temperature [°C]
Figure 5. Operating Supply Current (I
OP
) vs. T
A
Figure 6. Operating Switching Current (I
OPS
) vs. T
A
0.60
0.70
0.80
0.90
1.00
1.10
1.20
1.30
1.40
-40℃ -25℃ 0℃ 25℃ 50℃ 75℃ 100℃ 125℃
Normalized
Temperature [°C]
0.80
0.85
0.90
0.95
1.00
1.05
1.10
1.15
1.20
-40℃ -25℃ 0℃ 25℃ 50℃ 75℃ 100℃ 125℃
Normalized
Temperature [°C]
Figure 7. Startup Charging Current (I
CH
) vs. T
A
Figure 8. Peak Drain Current Limit (I
LIM
) vs. T
A
0.80
0.85
0.90
0.95
1.00
1.05
1.10
1.15
1.20
-40℃ -25℃ 0℃ 25℃ 50℃ 75℃ 100℃ 125℃
Normalized
Temperature [°C]
0.80
0.85
0.90
0.95
1.00
1.05
1.10
1.15
1.20
-40℃ -25℃ 0℃ 25℃ 50℃ 75℃ 100℃ 125℃
Normalized
Temperature [°C]
Figure 9. Feedback Source Current (I
FB
) vs. T
A
Figure 10. Shutdown Delay Current (I
DELAY
) vs. T
A