OMB-CHARTSCAN-1400 Portable Data Recorder p/n August 2002 OMB-483-0901 Rev 3.
OMEGAnetSM On-Line Service http://www.omega.com Internet e-mail info@omega.com Servicing North America: USA: One Omega Drive, Box 4047 Stamford, CT 06907-0047 Tel: (203) 359-1660 e-mail: info@omega.com Canada: 976 Berger Laval (Quebec) H7L 5A1 Tel: (514) 856-6928 e-mail: canada@omega.
How To Use This Manual Chapter 1: ChartScan Unit Startup and ChartView Tutorial provides information to get your ChartScan system up and running. The chapter includes installation steps, basic concepts regarding the ChartView software program, and a ChartView tutorial to quickly familiarize you with the software. Chapter 2: General Information gives a general description of ChartScan and related hardware including ChartScan’s expansion module and available signal conditioning cards.
Table of Contents 1 ChartScanUnit Startup & ChartView Tutorial CSN/Relay Card (for High-Current Digital-Output) ……3-19 Overview…… 1-1 Unit Startup……1-2 Expansion Chassis, CSN/Exp (Option) ……3-20 Inspect Your System……1-2 Install Software……1-2 Check and Install Hardware……1-3 Verify Voltage Setting……1-3 Verify DIP Switch Setting……1-3 Install Signal Conditioning Card(s)……1-3 Install Interface Communications Card (option)… 1-4 Connect Expansion Chassis (option)……1-4 Connect ChartScan to your computer……1-4 A
eZ-PostView and ViewXL 6 Calibration Introduction ……6-1 Calibration Setup ……6-1 Non-Volatile Storage of Calibration Constants ……6-1 Hardware Protected RAM ……6-2 ScanCal Software Application ……6-3 ScanCal’s Main Window ……6-3 Using ScanCal ……6-3 Interface Parameters System Inventory Calibration Appendices Appendix A API Commands Appendix B Configuration Aspects for Programmers Appendix C Registers, Data Formats, & Queries Appendix D ChartScan Program Examples Appendix E Bus States, Bus Lines, an
iv ChartScan User’s Manual
ChartScan Unit Startup and ChartView Tutorial 1 Connect ChartScan to your computer……1-4 Apply power to ChartScan…… 1-5 Connect Channel Signal Inputs……1-5 Start ChartView, Configure System, and Collect Data……1-7 Overview…… 1-1 Unit Startup……1-2 Inspect Your System……1-2 Install Software……1-2 Check and Install Hardware……1-3 ChartView, Basic Concepts……1-10 Verify Voltage Setting……1-3 Verify DIP Switch Setting……1-3 Install Signal Conditioning Card(s)……1-3 Install Interface Communications Card (option)…… 1
The basic Startup Steps are: 1. Inspect Your System 2. Install Software 3. Check and Install Hardware a. Verify Correct Voltage Setting b. Verify Correct DIP Switch Setting c. Install Signal Conditioning Card(s) d. Install Interface Communications Card (option) e. Connect Expansion Chassis (option) 4. Connect ChartScan to Your Computer 5. Apply power to ChartScan 6. Connect Channel Inputs 7. Start ChartView, Configure System, and Collect Data Unit Startup 1.
3. Check and Install Hardware Depending on your order, your ChartScan unit may not require all the steps under this heading. If a step does not apply to your unit, simply go on to the next one. a) Verify Voltage Setting Based on your order, your ChartScan system was set at the voltage indicated on the sticker (located on the rear of the unit, near the power switch). Verify that the voltage value indicated on the sticker matches the voltage of your intended AC power supply.
CAUTION Use approved ESD precautions, including static-free work area and grounded wrist strap, when handling circuit boards and electronic components. Failure to do so could cause equipment damage due to electrostatic discharge. CAUTION Only one CSN/Relay card can be used in a ChartScan system. Attempts to install the CSN/Relay card in a slot other than slot #1 of ChartScan’s main unit can cause equipment damage. The CSN/Relay card, if used, must be installed in the bottom slot of the main unit.
5. Apply Power to ChartScan ChartScan can be powered from a standard AC outlet. Use the following steps to connect power to your unit. 1. Make sure ChartScan’s power switch is in the “0” (OFF) position. 2. Plug power cord CA-1 into ChartScan’s power connector, located on the rear panel. Plug the other end of the cord into an appropriate receptacle. 3. Turn ChartScan’s power switch to the “1” (ON) position. The Power LED should light up.
ChartScan has eight digital input lines and thirty-two digital output lines available on the rear panel DB-50 connector. CAUTION Do not exceed the 0.0 to 5.3 volts levels described above. Exceeding these levels may damage the ChartScan unit in a way not covered by the warranty. Each digital output line will drive five (5) standard TTL loads. All digital input lines are one-eighth (0.125) TTL loads. All inputs are protected against damage from high static voltage.
7. Start ChartView, Configure System, and Collect Data Note: First time users should skip this step and return to it after reviewing ChartView, Basic Concepts and completing the ChartView Tutorial. Note: The configuration file, discussed in this section, will not be present during your first start of the program. Use the ChartView icon in Windows to start the ChartView program. ChartView will run using the latest configuration file. This is a file which is automatically saved upon exiting the program.
ChartView Main Window ChartView Main Window Control Options = Mouse, Ú= Arrow Keypads , = PageUp/PageDown Keypads 1 Group Select Ctrl+G, or Ú, or 14 Channel Selection 2 Start Charts & Indicators or, F5 15 Multiply (x2) 3 Pause Charts 16 Present Value of Selected Channel N/A 4 Stop Charts or, F7 or, F6 17 Center (Value at Chart Mid-Line) or, Ú, or type-in 5 Scroll Faster or, Ctrl+Z 18 or, Ú, or type-in 6 Scroll Slower or, Ctrl+X 19 Units/Division (Vertical incre
Once ChartView has a configuration file, you can start the program quickly using the Windows Run dialog box. Before executing this command [by clicking on the OK box] specify a configuration file as a command line parameter. In the following example, the user has specified a configuration file which he had previously saved as Test1.cvw. Note: The file name can be manually entered, or can be accessed using the pull-down arrow and scrolling the list of available file names.
ChartView, Basic Concepts An understanding of the following basic concepts will help you master ChartView more quickly, and should be understood before proceeding with the tutorial. Configuration Files ChartView makes use of one or more “user transparent” configuration files. Configuration files maintain information regarding various aspects of your setup, serving as an initialization file for subsequent ChartView startups. These files can be recognized by their .cvw extensions.
Three Ways of Using ChartView You can use ChartView to: • chart and monitor specific channels with no acquisition of data to disk • acquire data with no charting or meter use • use charting and/or meters while acquiring data to disk Chart channels (and/or monitor with meters) with no acquisition of data to disk Prior to charting channels on ChartView’s Main Window, you need to configure a display in regard to groups, charts, and channels.
1. Select Interface Device ◊ (1) From Windows, start ChartView by double-clicking on the ChartView icon. The ChartView Startup dialog box appears. ChartView Setup Dialog Box ◊ (2) Choose the Select Device button. The Select Interface Dialog Box appears, as indicated in the following figure. Note: The Load File button is for loading a previously saved configuration file. ◊ (3) Select Simulated Instrument.
Chart Setup Wizard, Automatic Options Setup Type Group Setup Chart Setup Channel Setup 1 group only Up to 16 charts 1 channel per chart Simple 1 group only Up to 16 charts Up to 4 overlapping channels per chart Moderate* Up to 64 groups Up to 16 charts per group Up to 4 overlapping channels per chart Advanced* *Moderate and Advanced modes are only available with activation of ChartView Plus. Note: Once your chart setup is complete you can always go back and edit the setup.
3. Configure Channels & Alarms Configure channels and alarms as follows. ◊ (14) On ChartView’s Main Window, click on Setup in the pull-down menu row. The Setup pull-down menu appears, allowing you to make more specific selections. ◊ (15) Click on the Channels & Alarms selection. The Channel and Alarm Setup dialog box appears, similar to that shown in the following figure. ◊ (16) Enable the desired channels.
Acquisition Dialog Box, Normal Mode ◊ (19) Click “Okay” to exit the Acquisition dialog box. Note that we are using the Acquisition default settings, and the Data Destination default settings in this tutorial (as shown in the above figure). Note: The following table provides a brief description of various acquisition setup parameters.
5. Review Configuration. Reviewing the configuration prior to data acquisition is optional; however, you should complete a review at this time (in the tutorial) to help with your familiarization of ChartView. In an actual application, a review such as this provides you with a chance to correct configuration errors. ◊ (20) Device Interface Check the Interface and Status via the Device pull-down menu.
A Note In Closing. This completes the tutorial. You may continue running ChartView in the simulated instrument mode and try various options to get a better feel for the program. Remember, while in the simulated instrument mode there are no ChartScan hardware concerns.
ChartScan User’s Manual
General Information 2 CAUTION If equipment is used in any manner not specified in this manual, or if specification limits are exceeded, the function of the equipment, as well as the protection provided by it, may be impaired.
In addition to the features of ChartScan described thus far, the unit includes: • Thirty-two TTL (Transistor-to-Transistor Logic) digital alarm outputs and 8 TTL-compatible digital inputs. • Two programmable scan rates: (1) a programmable scan rate for pre-trigger and post-trigger sampling, and (2) a programmable scan rate for accelerated sampling on-event detection. • A built in real-time clock that synchronizes the acquisition to the time of day, and provides time and date stamping for trend analysis.
16-Channel Signal Conditioning Cards (Optional) Low-voltage with removable (CSN14/LV/T) terminal block input module Low-voltage with BNC input (CSN14/LV/B) module Low-voltage with safety jack (CSN14/LV/S) input module Isolated TC/voltage with (CSN14/TC/P) plug type input module Isolated high-voltage with (CSN14/HV/S) safety jack input module Cables CA-7-3, Shielded IEEE 488 cable, 6 ft.
General Installation Category: • CE: Category 2 for Line Voltage Input terminal. All other terminals are Category 1. Warm Up: • 1 hour to rated accuracy. Expansion Connector: • 40-conductor connector for connecting expansion chassis via ribbon cable. ChartScan’s expansion connector (PH401) is located on the analog backplane. Chassis Ground Connection: • Screw terminal. Dimensions: • 330 mm wide × 241 mm deep × 152 mm high (13” × 9.5” × 6”). Weight: • ≈ 6.75 kg (15 lbs.
Triggers Installation Category: • CE: Category 1 Programmable Triggering: • Temperature or Voltage level (above or below), absolute time of day, alarm condition (on or off), IEEE GET, IEEE TALK, external TTL trigger (rising or falling), specified number of readings. Temperature-Level Trigger: • Programmable value for any one channel. Not available in Burst mode. TTL Trigger: • Programmable for rising or falling edges.
Digital I/O Interface & Alarms Installation Category: • CE: Category 1 Number of Digital Inputs: • 8 bits, LS-TTL compatible. Number of Digital Outputs: • 32 bits, TTL level compatible. Can be programmed as alarms. Note: The 32 TTL outputs can be set or cleared via program control. Alarm Conditions: • May be detected by SRQ or by software query (SPOLL or U command). Alarm Update Rate: • Alarms are updated whenever a channel assigned to an alarm is measured.
Calibration Calibration must be completed periodically to ensure equipment is accurate, and can be performed manually, or with the use of ScanCal. Chapter 6 contains instructions, including calibration equipment requirements, for the following: ChartScan main unit calibration for offset and gain Offset calibration for all card types Gain calibration for low volts cards Gain calibration for high volts cards Cold junction calibration for TC cards Note: ChartScan main unit constants are stored in NV-RAM.
− Notes 2-8 General Information ChartScan User’s Manual
Hardware 3 Overview ……3-1 Front Panel ……3-1 Rear Panel ……3-2 Power Aspects ……3-3 External TTL BNC Connectors ……3-14 Signal Conditioning Cards ……3-14 CSN14/TC/P Thermocouple and Low Volts Card with Subminiature Plugs ……3-15 CSN14/LV/ (T, B, & S) Low Voltage Cards ……3-17 CSN14/HV/S High Voltage Card with Safety Jack Connectors ……3-18 Changing the Voltage Setting ……3-3 Replacing the AC Power Supply Fuse ……3-4 Memory Configuration ……3-4 Expanded Memory Options ……3-4 Calibration Memory Write Enable/Disable
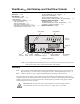
Rear Panel ChartScan’s rear panel contains several items, including a set of LEDs for status indication. The LED indicators are described in the following table. Other rear panel items are listed in a separate table following the illustration. LED Indicators, Chassis ALARM ON when an alarm has occurred. The indicator remains ON until the alarm condition clears. OFF when no alarm condition exists.
Power Aspects Changing the Voltage Setting Based on your order, your ChartScan system was set at the voltage indicated by a sticker or tag (located on the rear of the unit, near the power switch). If you need to change the voltage selection, complete the following steps.
Replacing the AC Power Supply Fuse Fuse: 1/2A, 250V, Slo Blo, 3AG for 105-125V power line, or 1/4A, 250V, Slo Blo, 3AG for 210-250V power line CAUTION Fuse failure indicates a possible problem within the device circuitry. If a fuse blows, contact a qualified service representative. Replacement fuses are to be installed by qualified service personnel with the unit disconnected from the power source and with all other terminals disconnected.
WARNING Never disassemble ChartScan’s case while it is connected to the AC power line! Internal voltage potentials exist which could cause bodily injury or death! Prior to disassembly: (1) turn off power (2) disconnect analog lines (3) disconnect AC power line (4) disconnect all additional lines WARNING Never disconnect the AC power line from ChartScan while analog connections to an external device exist! Common mode voltage potentials exceeding 60 VDC or 30 Vrms may exist which could cause bodily injury o
Calibration Memory Write Enable/Disable ChartScan’s constants for chassis calibration and the calibration password are stored by ChartScan in Non-Volatile RAM (NV-RAM). The password is a safety feature used to prevent unauthorized personnel from entering calibration mode and altering the calibration constants.
Steps for RS-232/422 Configuration Standard Units, Only Early Production Units, Only 1. Turn the ChartScan system’s power “OFF.” 1. Turn the ChartScan system’s power “OFF.” 2. Ensure the COMM SELECT micro-switch (on the rear-panel DIP switch) is in the “0” (down) position. 2. Ensure the COMM SELECT micro-switch (on the rear-panel DIP switch) is in the “1” (up) position. 3. Adjust micro-switches 2 through 9 (for parameter preferences), according to the following table for standard units. 3.
Serial Port Pin Connectors An optional CA-47 cable (or equivalent) connects ChartScan to the computer. The ChartScan side of the cable has a male DB9 connector for use with the RS-232/422 serial port. The cable’s computer side has 2 connectors: one for DB9, and the other for DB25. Other crossover-type cables can be used if wired as shown in the figure. The following table lists the RS-232 and RS-422 pin connections for a DB9.
Serial Port Pin Connector Signals for RS-232/422 Applications RxD- (Receive Data Negative) Input: This pin accepts serial data sent by an RS-232 or RS-422 device. The serial data received is expected to match the word length, baud rate, stop bits, and parity configuration of the particular port. The signal is low true. RxD+ (Receive Data Positive) Input: This pin accepts serial data sent by an RS-422 device only. The signal is high true.
IEEE 488 Interface Configuration (Option) The IEEE 488 interface option is intended for digital communication with IEEE 488 compliant computer platforms, as well as IEEE 488 compliant platform-independent configurations. Data is transmitted parallel, as opposed to serial. The IEEE 488 option allows for up to 15 devices to be connected to one bus; with a total bus length of up to 20 meters. Allowable cable distance between devices is up to 2 meters. Message transactions are hardware handshaked.
IEEE 488 Configuration WARNING Never remove or install an interface card while ChartScan/1400 is connected to the AC power line! Internal voltage potentials exist which could cause bodily injury or death! WARNING Never disconnect the AC power line from ChartScan/1400 while its analog lines are connected to an external device! Common mode voltage potentials exceeding 60 VDC or 30 Vrms may exist which could cause bodily injury or death! CAUTION Use approved ESD precautions, including static-free work area
IEEE 488 Configuration Settings Standard Units, Only Early Production Units, Only 1. Ensure IEEE 488 Interface is installed. 1. Ensure IEEE 488 Interface is installed. 2. Turn the ChartScan system’s power “OFF.” 2. Turn the ChartScan system’s power “OFF.” 3. Ensure the COMM SELECT micro-switch (on the rear-panel DIP switch) is in the “1” (up) position. This selects IEEE 488. 3. Ensure the COMM SELECT micro-switch (on the rear-panel DIP switch) is in the “0” (down) position. This selects IEEE 488.
Digital I/O Lines ChartScan has eight digital input lines and thirty-two digital output lines available on a rear panel DB-50 connector. These lines can be output and/or input using ChartScan commands. Note: The first 16 output lines are available for use with relays via the high current CSN/Relay card option. If used, the relay card must be installed in slot 1 (bottom slot) of the ChartScan main unit. The CSN/Relay card is discussed at the end of this chapter.
External TTL BNC Connectors ChartScan’s rear panel provides two external trigger BNC connectors. The BNC TTL Scan output is used for synchronizing equipment with ChartScan. ChartScan can be programmed to trigger on a rising or falling TTL level. Any TTL level signal (> 2.2V = Hi, < 0.8V = Lo) may be used as a trigger pulse. A trigger pulse may also be used to generate a Service Request. Note that the TTL Out is a LS-TTL compatible output, 0.4 mA sourcing, 8 mA sinking.
CSN14/TC/P Thermocouple and Low Volts Card with Subminiature Plugs The CSN14/TC/P card contains 16 differential input channels, each of which may be configured as any thermocouple type or as a milli-volt input. Temperature values may be returned in units of °C, °F, °K, °R, or mV. This signal conditioning card contains “subminiature plug type” connectors. There are no user configuration switches or jumpers on the CSN14/TC/P card.
Digital Filtering: • Averages 32 samples at 50/60 Hz for line cycle noise rejection (VDC measurements) Voltage Range2, Accuracy3 and Resolution: • ±100 mV ± 0.02% 3.05 µV/bit • ±1 V ± 0.02% 30.5 µV/bit • ±5 V ± 0.02% 153 µV/bit • ±10 V ± 0.02% 306 µV/bit 3-16 Note 1: Accuracy is based on 18 to 28°C, 1 year; includes cold junction compensation; excludes thermocouple errors; thermocouple readings based on NIST Monograph 175. Resolution given is the typical value.
CSN14/LV/ (T, B, & S) Low Voltage Cards There are three versions of low voltage signal conditioning cards for use with ChartScan. Each card supports 16 differential input channels and is capable of measuring analog input signals on any of four programmable ranges: ±100 mV, ±1 volt, ±5 volt and ±10 volt. The cards share the same signal conditioning characteristics, but differ in their style of input connector, i.e., terminal strip, BNC, and safety jack (CSN14/LV/T, CSN14/LV/B and CSN14/LV/S, respectively).
CSN14/HV/S High Voltage Card with Safety Jack Connectors The CSN14/HV/S card contains 16 differential input channels and is for use with “safety jack” type connectors. Each CSN14/HV/S card is capable of measuring analog input signals on any of the following three programmable ranges: ±2.5 volt, ±25 volt and ±250 volt.
CSN/Relay Card (for High-Current Digital-Output) CSN/Relay Card The high-current digital-output CSN/Relay Card allows you to add relay functions to the first 16 digital outputs. The CSN/Relay card installs into ChartScan’s slot 1 (bottom card slot). Only one relay card can be used per ChartScan unit, and a relay card can not be installed in a ChartScan expansion chassis. The CSN/Relay Card uses 16 dual-coil latch relays and associated circuitry to minimize load on ChartScan’s internal power supply.
CSN/Relay Card Specifications Number of Channels: • 16 (2 groups of 8 channels) Relay Contacts (Manufacturer’s Ratings):* • 8 Amps, 125-250 VAC Resistive • 5 Amps, 30 VDC Resistive Card Contact Ratings: • 8 Amps maximum on group commons Contact-to-System Isolation: • 500 Volts (AC or DC) *Manufacturer’s ratings for the relays used on the CSN/Relay Card. Expansion Chassis, CSN/Exp (Option) You can add up to 64 additional analog channels to ChartScan by using a CSN/Exp expansion chassis.
Cover Plate Screw (1 of 2) Cover Plate Expansion Chassis Mounting Block (1 of 4) Ribbon Cable CA-154 (Included) Connector PH401 (on back side of Analog Backplane Board) Cross Section of Mounting Block ChartScan Connecting the Expansion Chassis to ChartScan 4. Insert one end of the included 40-conductor ribbon cable (CA-154) into ChartScan’s connector PH401. PH401 is located above the uppermost signal conditioning connector on the top edge of the analog backplane card.
Automatic Channel Assignment Unless the CSN/Relay card is used, Channels 1 through 64 are automatically assigned to ChartScan, while extended channels 65 through 128 are assigned to the expansion chassis. Even if a card slot is left empty in the ChartScan or the expansion chassis, the channel assignments are as shown in the table, with slot 1 being at the bottom of the unit, and slot 4 being at the top.
Expansion Chassis Specifications WARNING Service must be performed by qualified personnel. All terminals, including the AC line and analog inputs, must be disconnected prior to opening ChartScan main unit or expansion chassis casing. Internal voltage potentials exist which could cause bodily injury or death! CAUTION The Expansion Chassis contains no fuses; However, fuse failure in ChartScan’s main chassis indicates a possible problem with device circuitry.
− Notes 3-24 ChartScan User’s Manual
ChartView Software Reference 4 ChartView, ChartView Plus, ChartViewNET, and ChartViewNET Plus Overview ……4-1 Groups, Charts, & Channels ……4-2 Three Ways of Using ChartView ……4-2 What ChartView and ChartView Plus Provide ……4-3 Main Window ……4-4 Channel Information Region ……4-6 Status Indicator Region ……4-7 Main Window Toolbar ……4-8 Group Select ……4-8 Start, Pause, and Stop Charts ……4-8 Scroll Faster & Scroll Slower ……4-8 Display Configuration ……4-9 Channel Configuration ……4-15 PostView post-acq data view
Groups, Charts, & Channels When starting the program with no configuration file present (see Chapter 1 if necessary), a feature called Chart Setup Wizard is automatically activated to assist you with your display setup. To make the best use of Chart Setup Wizard you need to understand the relationship of Groups, Charts, and Channels. Group. “Group” refers to a group of charts. ChartView makes use of one chart group.
Some of the data acquisition scenarios pertaining to ChartView are as follows: 2) Acquiring & Uploading Acquisition 1) Waiting for Trigger Hard Disk Sensor Buffer Buffer Acquisiton Device Computer System Data is received by acquisition device, but not stored. Selected channels can be viewed graphically in scrolling charts, as well as in one or more meters (analog, digital, or bar graph). Acquisiton Device Device has been triggered.
Main Window While using this chapter, refer to the Main Window figure and its associated control option table as needed. Because of the graphic aspect of the window, you should be able to develop a good understanding of the program’s capabilities and associated operating techniques within a very short time. The following comments apply to the figure and table on the following page.
ChartView Main Window and Control Options = Mouse, Ú= Arrow Keypads , = PageUp/PageDown Keypads Note: The bulleted list on page 4-4 relates to this table.
Channel Information Region Channels can return values in units of °C, °F, °K, °R, mV, V, or user defined units (if the mX + b option is used). With exception of mX + b user defined-units, units depend on the configuration and type of signal conditioning card used. Signal conditioning cards are detailed in the user’s manual for you data acquisition device. The Channel Information Region is located on the right-hand side of ChartView’s main window.
Units/div - The units in units/div (18) can be °C, °F, °K, °R, mV, or V. The division referenced is one vertical grid. In the example above for Channel 1, each vertical grid increment represents 10.58°C per division. Changing the units/division spinner controls (σ/τ) will result in an automatic adjustment of the max scale and min scale values (items 13 and 19).
Main Window Toolbar Each item in the toolbar, with exception of Group Select (1), is represented by an individual button icon. Toolbar-related functions can also be activated from pull-down menus (discussed later). Placing the cursor on the button and clicking the mouse button enables the tool, or opens a corresponding dialog box. Each Toolbar button has a pop-up label that appears when the mouse is placed over the button. Note: The toolbar represented below is for ChartView’s Main Window.
Display Configuration The Display Configuration button accesses a Display Configuration Setup dialog box. This box will also be displayed if: a) Create Charts Manually is selected during use of the Wizard Chart Setup program, b) you select Setup from the Chart pull-down menu, c) you right-click on the chart region in ChartView’s Main Window. Note: If multiple chart groups are present in the display configuration, the current group will be selected in the display configuration tree.
Display Configuration Setup Dialog Box with an Existing Configuration Note: When a chart contains overlapping channels [and the channels share values such that their traces reside on top of each other], then the channels listed lower in the display list (the most recently added channels) will obscure the channels higher in the list (those that were added first). Adding Channel 2 to Chart 1 Another variation of the Display Configuration Setup box appears when you highlight a channel.
Adjusting Channel Setup for Channel 1 ChartView and ChartView Plus data channels can operate in one of two modes: Units Full Scale or, Units/Div. The mode is selected by radio button. Units Full Scale. When Units Full Scale is selected, as depicted in the above figure, you can alter Y Max and Y Min. These are the upper and lower limits of the Channel as they will appear on the chart when the channel is selected. When you change either parameter, Y Center and Units/Division are automatically adjusted.
Manually Creating a Display For ChartView Plus users, if you plan to have a chart setup that is not weighted evenly, i.e., different numbers of channels per chart and different numbers of charts per group, you may want to manually setup your chart display from scratch, i.e., without beginning from a pre-existing display configuration. This method is arrived at from the Chart Setup Wizard window by selecting “Manual Chart Creation.
(4a) Automatically add groups to the setup. Enter the number of groups and charts desired by using the cursor and typing in the value, or by using the pull-down arrows (τ) and making the appropriate selections; then click on the Create Groups button. (4b) Manually add groups to the setup. Type in the name of the chart group; then click on the Add Display Group button.
9. Choose channels for the selected chart. With ChartView Plus, you can select up to four overlapping channels per chart. With the basic ChartView program, you are limited to one channel per chart. There are four methods of adding channels. These are as follows: • Highlight an available channel using the cursor and left-hand mouse button; then click the Add button. Repeat for each channel to be added.
Channel Configuration The “Channel Configuration” button brings up the Setup Window with one of three “tabbed” dialog boxes displayed: Acquisition Setup (page 4-33), Channel & Alarm Setup (page 4-33), or Data Destination (page 4-39). The information entered in the Acquisition Setup dialog box is used by the Arm Acquisition command to set up the acquisition of data to disk. When the trigger is satisfied, the scans are collected at the selected scan frequency and stored to disk in the designated file.
Print Charts The Print Charts button activates a screen print of ChartView’s main window. Main Window Pull-Down Menus The ChartView main window features several pull-down menus. As an alternative to the menus, you can enable several menu items by using Toolbar buttons, previously discussed. The common items (for the pull-down menus and toolbar) are described in more detail in the Toolbar section.
File Menu Note When ChartView is started for the very first time there is no default channel configuration file. In this case a ChartView Startup dialog box appears, providing you with the following four choices: Retry, Select Device, Load File, and Exit Program. After choosing Select Device a Select Interface dialog box appears, allowing you to choose IEEE 488, RS-232/422, Network, or Simulated Instrument. For ethernet operation, “Network” must be selected as the device interface.
Display config. Note: Start Stop Pause F5 F6 F7 Allows you to: Open a previously saved display configuration file, save the current display configuration file, or save the current display configuration file in a different location (or under a different file name). (See following note). There will be no default Display Configuration file present the first time ChartView is started. In this case, Chart Setup Wizard activates, allowing you to create a display setup.
Options Option Settings includes three separate dialog boxes, accessible by tabs, as indicated in the following screen captures. Charts Restricts Scroll Speed to Eliminate Aliasing It is possible for chart displays to exhibit aliasing when using ChartScan, NetScan, or MultiScan devices. The aliasing effect can be eliminated from the display by enabling the “Restrict scroll speed to actual scan rate” feature. This reduces the scroll speed to a range that results in non-aliased displays.
Acquisition (continued) Automatic Keyboard This feature works in conjunction with Keyboard Triggering when Auto Re-arm is being Trigger used. Auto Re-arm is discussed on page 4-42. on Auto Re-arm If the option is disabled, acquisition data is saved to disk, and the device automatically re-arms. ChartView displays the Trigger dialog box and waits for the trigger button to be pressed by the user before beginning the next acquisition.
Command Characters This area contains two fields for entering command characters, one for row setting and one for column setting. Enter the characters (Excel parameters) to match the applicable version of Excel; for example: France - Row = L, Column = C Germany - Row = Z, Column = S United States - Row = R, Column = C. Data Destination Assign the Data Destination. This area allows you to assign the data destination on the Excel spreadsheet.
Upload Available Scans Enables ChartView to access device memory for all scans currently available. This function only uploads scans that are currently available. (Ctrl + U) (manual control) Upload Scans Until Done Enables ChartView to access device memory and upload scans until scanning is complete. Window Bar Graph Meters Selecting Bar Graph Meters from ChartView’s Window pull-down menu brings up the Bar Graph window. This window displays several channels in bar graph format.
Device … Interface ¾ Setup IEEE 488 The IEEE 488 Setup dialog box appears. Valid addresses are 0 to 30. DIP switch settings must agree with this setup. For ChartScan, an IEEE 488 interface card is required for use of IEEE 488 interface. NetScan devices can not make use of the IEEE 488 interface. When using ChartView with IEEE 488 applications, you must make use of an IOtech Driver 488/W31, /W95, or /WNT when made available. In addition, the device must be configured in the Driver 488 and be named WAVE.
Setup Network Brings up the Network Interface Settings dialog box. A valid registration number must be entered (1st screen below) to gain access to the ChartView’s Network Interface support feature. The second dialog box allows users of NetScan or Net232 to configure the ethernet interface. The program will generate data from a simulated instrument with no actual hardware concerns. Simulated Instrument Device … Status ¾ Instrument Inventory Accesses the System Inventory dialog box.
From the Alarm configuration dialog box, you can define the information that will be saved in the log file. Options include the Time and Date when the state change occurred, the Alarm number, the Channel(s) that tripped the alarm along with the current reading, and the state of the alarm itself or all alarms, either 1 or 0. Additionally you can define the character that is used to separate the information in the file.
Log Enable (Ctrl+A) Once an alarm log file exists, log enable can be used to activate the logging process; or to disable an active log. A check-mark (9) preceding Log Enable indicates that the log is active. No check-mark present indicates the alarm log has not been enabled. Instrument Error Status Brings up the Device Error Status dialog box. This box lists existing error types, including invalid command and channel configuration errors.
Setup Channels & Alarms Ctrl+L Accesses the Setup Window for configuring channels and alarms. From the channels & alarms dialog box, you can select the Acquisition Setup and Data Destination dialog boxes. Acquisition Ctrl+C Accesses the Acquisition Setup dialog box. From the Acquisition Setup box, you can select the Channels & Alarms dialog box, as well as the Data Destination dialog box.
Bar Graph Meters Selecting Bar Graph Meters from ChartView’s Window pull-down menu brings up the Bar Graph window. This window displays several channels in bar graph format. To activate the display, select the Start button from the toolbar. At least one meter must be assigned to an active (On) channel. You can select to view up to 32 meters at a given time.
Analog Meters Selecting Analog Meters from ChartView’s Window pull-down menu brings up the Analog Meters window. This window displays several channels in a dial/gage format. To activate the display, select the Start button from the toolbar. At least one meter must be assigned to an active (On) channel. You can select to view up to 32 meters at a given time.
Digital Meters Selecting Digital Meters from ChartView’s Window pull-down menu brings up the Digital Meters window to display several channels in numeric format. To activate the display, select the Start button from the toolbar. At least one meter must be assigned to an active (On) channel. You can select to view up to 32 meters at a given time.
Meter Toolbars The toolbars for the three meter types are identical, with exception that the Digital Meters toolbar does not have a Reset Peak Hold button (item C in the following figure). Meters Toolbar Buttons Item Name Function A Start Starts meters. B Stop Stops meters. C Reset Peak Hold Indicator Resets the floating markers. Upon reset, the markers will instantly adjust to indicate the highest and lowest values reached since the time of the reset.
Meters Configuration Menu A meters configuration menu (lower left corner of figure) will appear when you place the mouse pointer over a meter and click the right-hand mouse button. The menu allows you to access various dialog boxes for changing parameters for an individual meter, or simultaneously for a group of meters. The steps for configuring a meter are detailed below.
Configure Meter Settings, Function Descriptions Function Description 1 Select Channel Select a new channel for display. The selected channel will replace the one currently seen in the meter. Note, double-clicking the left mouse button in the meter region will also bring up a dialog box that allows you to select a new channel. 2 Set Scale Set the high and low points of the scale, as well as define the decimal place format.
Channel and Alarm Setup Dialog Box Channel and Alarm Setup, Button Descriptions 1 – Turn On All Channels (Alt + N) 2 – Turn Off All Channels Not Assigned to Charts (Alt + F) 3 – Turn On/Off Channel Readings (Alt + R) 4 – Print Entire Channel and Alarm Setup (Alt + P) The following table indicates message and pull-down menu aspects of the Channel and Alarm Setup Dialog Box.
Channel Configuration Columns 1) Channel (CH) This column serves only as a channel number indicator. The channel number cannot be changed from this column. 2) On The On column allows you to enable a channel for data collection. When a cell or block of cells in this column is selected, a selection box will appear that allows “On” to enable or “Off” to disable the channel. Double-clicking a cell in this column toggles the channel’s enable status.
Note: When using a channel as a reference channel, remember that lower numbered channels are calculated ahead of higher numbered channels, e.g., CH1 is calculated ahead of CH2. This makes a difference when subtracting a reference channel in regard to the time aspect of the reference value. If the channel is configured for Volts, the units automatically change to V; at this point, you have the option of selecting the millivolt unit (mV).
The mode is selected from the lower left-hand portion of the dialog box. The following figure represents a screen capture with normal mode selected. Acquisition Setup Dialog Box, Normal Mode The following figure depicts components of an acquisition. The Trigger and Stop Points represent the entries described under the Event Configuration selection in the table on the following page.
Acquisition Setup Parameter Event Configuration Options Trigger: Set a trigger scan in the Acquisition by using one of the following: Keyboard - Use Console Trigger dialog box to start trigger scan. Note: If the Keyboard Trigger is selected the use of Pre-trigger is disabled. External TTL - Use an external signal to start the trigger scan. Channel Value - Use specified value of a given channel. Alarm - Use an Alarm value to start the trigger scan.
Burst Mode, Operational Issues Acquisition Setup Dialog Box, High-Speed, Single-Channel Mode The Burst Mode, also referred to as High-speed, single-channel mode, is selected with a radio-button located on the lower left of the Acquisition Setup Dialog Box. The following bulleted issues apply to Burst Mode operations. • When in the High-speed, single-channel (burst mode), all ChartView display functions are intentionally disabled.
• When using Burst Mode, data saved to disk can still be viewed in PostView. However, the PostView chart setup will only allow you to select the single channel (previously selected in ChartView as the high-speed Burst Mode channel). Example: If Channel 4 is selected as the High-Speed Setup Channel (in ChartView’s Acquisition Setup), and data is acquired and saved to disk, then the only channel that can be selected for PostView’s chart display is Channel 4.
Measuring AC RMS The following steps pertain to measuring AC RMS voltage. 1. Determine the peak voltage of the input signal. 2. Based on the value from step 1, select the appropriate VAC option. This is done in ChartView’s Channel and Alarm Setup window (see following figure). Choosing A Voltage Type 3. In the Acquisition Setup Dialog Box, set the Average Weight to “32.” Setting Average Weight to 32 (in the Acquisition Setup Dialog Box) 4. Run the acquisition as normal.
Data Destination Dialog Box Data Destination The Data Destination portion of the box is used to assign a filename and folder location for data, select an Excel or binary format (.TXT or .IOT respectively), and to select optional Time/Date and/or Alarm Stamps (to be included in the data) if desired. The dialog box can be accessed from the Channel and Alarm Setup and Acquisition Setup dialog boxes by selecting the Data Destination tab, or by selecting Data Destination from the Setup pull-down menu.
Why use Auto Re-arm? You can use Auto Re-arm as a convenient way to monitor and analyze specific types of trigger events. For example, if you set Channel 1 going above 30°C as a trigger, you can choose to repeat 100 (or more) acquisitions with this same trigger criteria (Channel 1 > 30°C). Whether you select to capture the trigger blocks in one file, or each in a separate file, each of the data acquisitions will occur automatically; and each will make use of your set configuration.
Chart Setup Wizard Reference Note: For very first time start-up of ChartView and a program tutorial (that includes a first time use of the Chart Setup Wizard) refer to Chapter 1. Introduction Chart Setup Wizard is a feature of ChartView, ChartView Plus and PostView. The feature allows you to set up your initial chart display configuration using an automated method, or manually create a new display configuration. The following points are important in regard to the Chart Setup Wizard.
A Manual Chart Creation, Create Charts button allows you to bypass the Chart Setup Wizard and enter a manual mode. This option makes use of ChartView’s Display Configuration feature (reference page 4-9). Manual chart creation allows you to vary the number of assigned channels per chart, as well as vary the number of charts per group.
It is a simple task to create chart display configurations using the automatic method. The following steps apply to this feature of Chart Setup Wizard. 1. Select Wizard from the Chart pull-down menu of ChartView’s main window. The New Display Setup dialog box appears. 2. Click OK on the New Display Setup dialog box. The Wizard setup window appears. 3. Select the desired mode tab (Simple, Moderate, or Advanced). Moderate and advanced modes are only available with ChartView Plus. 4.
eZ-PostView and ViewXL 5 Introduction ChartScan systems can now make use of the post-acquisition data viewing program, eZ-PostView and a Microsoft Excel add-in known as ViewXL. eZ-PostView is a time-domain post-acquisition data viewing application that has been integrated with primary data acquisition software, including DaqView, Personal DaqView, ChartView, LogView, and WaveView.
eZ-PostView includes the following features: • File Input Format Support for: DaqView, WaveView, Personal DaqView, ChartView, Universal File Format UFF-58B.
Calibration 6 Introduction ……6-1 Calibration Setup ……6-1 Non-Volatile Storage of Calibration Constants ……6-2 Hardware Protected RAM ……6-2 ScanCal Software Application ……6-3 Manual Calibration of Main Unit ……6-6 Offset Calibration of Main Unit ……6-6 Gain Calibration of Main Unit ……6-8 Manual Calibration of Signal Conditioning Cards ……6-10 Offset Calibration of Cards ……6-10 Gain Calibration of Low Volts Cards ……6-12 Gain Calibration of High Volts Card ……6-15 Cold Junction Calibration ……6-17 ScanCal’s Ma
CAUTION The digital voltmeter (or digital multimeter) used to verify calibration voltage accuracy must meet the following criteria: 1) Minimum Resolution: 6-1/2 digits 2) Minimum DC Accuracy: 0.005% full scale Failure to comply with this requirement can result in faulty equipment performance and necessitate additional services of an authorized metrology lab.
CAUTION Unless you are setting main unit calibration constants or changing the password, the calibration mode should be disabled. The calibration mode applies to main unit calibration, and not to the calibration of signal conditioning cards. ScanCal Software Application ScanCal’s Main Window Select the ScanCal option from the ChartView Program Group. ScanCal’s Main Window will appear. The window contains pull-down menus, a toolbar, and calibration instructions.
Interface Parameters If your data acquisition device interface is set up for Network (ethernet), you should change the device interface to RS-232 serial communications prior to performing calibration. Refer to your hardware setup chapter as needed. 1.a Select the DIP Switch toolbar icon to activate the Select & Verify Interface Setup window. This allows you to select and setup the communication interface used for your scanning system. Select & Verify Interface Setup 1.
Calibration Without ScanCal Password To perform calibration, the calibration mode must be enabled. The Enter Calibration Mode (K) command enables calibration, where keyword is the five-digit keyword (or password) currently configured for the unit. Your scanning unit is shipped with a default password of 12345. This password can be modified by the Change Calibration Keyword (*K) command, once Calibration Mode has been entered. Calibration mode is ended by executing the End Calibration Mode (E) command.
Calibration of Main Unit Offset Calibration of Main Unit Required Equipment - Shorting bar, or 3 linked banana plugs (see following figure) - Calibration Card (installed in bottom slot, slot #1, of the main unit) CAUTION Do not install or remove any cards from the main unit, or from its expansion chassis unless the unit is powered “OFF” and has no power sources connected to it.
1. Ensure the main unit is powered “OFF,” and has no power sources connected to it. 2. If a signal conditioning card is in slot #1 of the chassis, remove the card. 3. Install Calibration Card into Slot #1 (bottom slot) of the main unit. CAUTION Do not perform calibration until after the main unit and calibration equipment have been powered on for at least one hour. 4. With all covers in place, allow the main unit and calibration equipment to warm up (powered on) for at least 1 hour. 5.
Gain Calibration of Main Unit Required Equipment* - Volts DC Calibrator - 22-2 Twisted pairs (to connect calibrator to calibration card) - Digital Voltmeter, or Digital Multimeter (used for verification of calibration voltages) - Calibration Card (installed in bottom slot, slot #1, of main unit) * see required specifications on page 6-2 CAUTION Offset calibration of main unit must be completed prior to calibrating the main unit for gain.
1. Connect HI, LO, -S, and +S lines from the precision calibrator to the binding posts of the calibration card, as indicated in the figure above. 2. Apply -4.4 VDC (minus 4.4 VDC) from the calibrator to the calibration card. Use a precision digital multimeter to verify voltage accuracy.
Calibration of Signal Conditioning Cards Offset Calibration of Cards Required Equipment - BNC Short for CSN14/LV/B cards, see note - Terminal Type Short for CSN14/LV/T cards, see note - Banana Plug Type Short for CSN14/LV/S cards, see note - Type U Subminiature Plug Short for CSN14/TC/P cards, see note Note: The four types of shorting connectors are illustrated later in this section.
1. If the calibration password has not been changed, enter K12345. If the password has been changed, enter the K command and the current password. This enables the calibration mode. 2. Type U2X to verify calibration mode. U128 should appear, indicating the unit is in calibration mode. 3. Type H1X. The Trigger LED will flash, indicating that offset calibration is in progress for Channel 1. 4. Type U2X. U128 should appear, indicating the unit is in calibration mode and no errors have occurred.
Gain Calibration of Low Volts Cards Required Equipment* - Volts DC Calibrator - 22-2 Twisted pairs (to connect calibrator to calibration card) - BNC Harness (for CSN14/LV/B cards), see note -Terminal Type Harness for CSN14/LV/T cards, see note - Banana Plug Type Harness CSN14/LV/S cards, see note -Type U Subminiature Plug Harness for CSN14/TC/P cards, see note - Digital Voltmeter, or Digital Multimeter *see required specifications on page 6-2 Note: The four types of harnesses are illustrated later in this
1. Connect an applicable calibration harness to each card. Refer to figure below.
2. Apply calibration voltage from the precision calibrator to the first channel of each card (see following table), and verify with a digital multimeter. Requirements for both devices are specified in Required Equipment.
Gain Calibration of High Volts Cards Required Equipment* - Volts DC Calibrator - 22-2 Twisted pairs (to connect calibrator to calibration card) - Banana Plug Type Harness for CSN14/HV/S see note - Digital Voltmeter or Digital Multimeter (used for verification of calibration voltages) * see required specifications on page 6-2 Note: The harness for CSN14/HV/S is illustrated later in this section. WARNING High voltage potentials exist which could cause serious injury or death.
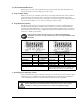
2. Apply calibration voltage from the precision calibrator to the first channel of each CSN14/HV/S card (see following table), and verify with a digital multimeter. Requirements for both devices are specified in Required Equipment. Volts DC Slot # 1 Slot # 2 Slot # 3 Slot # 4 Slot # 5 Slot # 6 Slot # 7 Slot # 8 -2.5 V G1,20X G17,20 X G33,20X G49,20X G65,20X G81,20X G97,20X G113,20X +2.5 V G1,20X G17,20X G33,20X G49,20X G65,20X G81,20X G97,20X G113,20X -25.
Cold Junction Calibration Required Equipment Equipment for CJC Calibration Cold (ice) cell for calibration with thermocouples at 0°C T/C wire and subminiature plug connectors (T-Type T/C wire is recommended) U-Type copper shorting plugs Thermocouples Equipment for Verification of Calibrated Temperature* Option (a): Cold Cell Method Cold (ice) cell Volts DC Calibrator Digital Voltmeter or Digital Multimeter 2-22 Twisted-pairs Voltage-to-temperature reference tables Thermocouples T/C wire and subminiature pl
CAUTION The main unit (chassis) and T/C cards must be calibrated for offset and gain prior to calibrating the T/C cards for cold junction. CAUTION Do not install or remove any cards from the main unit, or from its expansion chassis unless the unit is powered “OFF” and has no power sources connected to it. CAUTION Do not perform calibration until after the main unit has been powered on for at least one hour, and the Cold Cell powered on for at least 2 hours.
4. Type U2X to verify calibration mode. U128 should appear, indicating the unit is in calibration mode. 5. Enter commands similar to those in the first two columns in the following table. This example is for a T/C card in slot #1, and a Type 3 (“T” type) thermocouple. The table on the preceding page provides additional channel numbers to use as they apply to your system. Enter: J3,3,0000.0X J6,3,0000.0X J11,3,0000.0X J14,3,0000.
6-20 Calibration ChartScan User’s Manual
Appendices Appendix A API Commands Appendix B Configuration Aspects for Programmers Appendix C Registers, Data Formats, & Queries Appendix D ChartScan Program Examples Appendix E Bus States, Bus Lines, and Data Transfer Aspects Appendix F ASCII Code Summary Appendix G ChartScan Error Messages Appendix H Abbreviations Synopsis of Appendices With exception of Appendix G, these appendices provide programming-related information that is not necessary for users of ChartView and ChartView Plus.
A-ii ChartScan User’s Manual
Appendix A API Commands Contents Command Syntax................................................................................................................. A-2 Case Sensitivity...................................................................................................................... A-2 Spaces ................................................................................................................................... A-2 Multiple Parameters ............................................
API Commands Appendix A Command Syntax Commands are identified by the following syntax formats: • A single letter (A through Z) • A single letter (A through Z) followed by a pound sign (#) • An at-sign (@) • An asterisk (*) followed by a single letter (A through Z) In addition, the commands are governed by the following syntax rules. Case Sensitivity Commands may be entered in upper or lower case. For example, A1,1X is interpreted the same as a1,1X.
Appendix A API Commands Fixed Formats Any Query (?)command or Status (U) command returns a fixed format. For instance, any option that can range up to 65,535 always returns five digits, so zero would be returned as 00000. In the following command descriptions, leading zeros are included. They are not, however, required when entering the command.
API Commands Appendix A The following is a list of all the immediate and deferred commands for ChartScan.
Appendix A API Commands Deferred Commands, Order of Execution The immediate commands take effect immediately when they are interpreted. Even so, they must be followed by an Execute (X) command to terminate the command string for correct operation. For example: K00001X Deferred commands are not executed until the X command has been successfully parsed and interpreted.
API Commands Appendix A Command Summary @ Command Trigger On Command Syntax Trigger on receipt of an @. *B Flush Acquisition Buffer *B Flush any data currently in the acquisition buffer. *C Clear Channel Configuration *C Clear out the channel configuration so that no channels are configured. *F Restore Factory Settings *F Restore unit to factory configuration.
Appendix A API Commands D# Command Set Relay Make Time D#make Syntax Description Specify how long to wait after closing a channel relay before reading valid data, where make is the number of 520.833 microsecond intervals. E End Calibration Mode E Terminate Calibration Mode E? Error Status Query E? Returns present error condition of the unit with one of the following error codes: E000 - No error has occurred. E001 - Invalid device dependent command (IDDC).
API Commands L Appendix A Command Set Trigger Level Syntax Lchan, level, hyst L? M Set SRQ Mask Mmask M? Use the IEEE 488 Service Request (SRQ) mechanism to inform the IEEE 488 bus controller of certain conditions, where mask is in the form of the number nnn such that 000 < nnn < 255 is summed from the following conditions: 000 - Power-on default mask value. 001 - SRQ On Alarm. 002 - SRQ On Trigger Event. 004 - SRQ On Ready. 008 - SRQ On Scan Available. 016 - SRQ On Message Available (MAV).
Appendix A API Commands R Command Read Buffered Data Syntax Rtype R? Description Read scan data from the acquisition buffer where type is the type of data request being made. Valid options for type are: 1 - Read the oldest scan currently residing in the acquisition buffer, 2 - Read the oldest complete trigger block currently residing in the acquisition buffer, and 3 - Read all the scan data that currently resides in the acquisition buffer. Query the contents of the data buffer.
API Commands Appendix A − Notes A-10 ChartScan User’s Manual
Appendix A API Commands Command Reference The following pages provide the command set for ChartScan. For each command, the command name, the descriptive name, and the command description are given. In turn, the command description includes the following format. Command Description Format Type This item refers to the part of the system that the command acts upon.
API Commands Appendix A @ - Trigger On Command TYPE EXECUTION SYNTAX DESCRIPTION Acquisition Deferred @ Trigger upon receipt of an @ The Trigger On (@) command will start or stop the acquisition accordingly when the start or stop arguments of the Set Trigger Configuration (T) command is set to 1 (trigger on). The T command is used as a trigger source and follows the same rules as other trigger sources as defined by the T command.
Appendix A API Commands *B - Flush Acquisition Buffer TYPE EXECUTION SYNTAX DESCRIPTION Buffer Immediate *B Flush any data currently in the acquisition buffer The Flush Acquisition Buffer (*B) command will flush any data currently in the acquisition buffer. Upon execution of this command, all data currently in the acquisition buffer will be deleted and is unavailable to be read.
API Commands Appendix A *C - Clear Channel Configuration TYPE EXECUTION SYNTAX DESCRIPTION Channel Deferred *C Clear out the channel configuration so that no channels are configured The Clear Channel Configuration (*C) command will clear out the channel configuration so that no channels are configured.
Appendix A API Commands *F - Restore Factory Settings TYPE EXECUTION SYNTAX DESCRIPTION System Immediate *F Restore unit to factory configuration The Restore Factory Defaults (*F) command may be used to restore the unit to the same configuration it had when it left the factory. Issuing this command will cause the unit to load the factory default configuration into the working configuration. The factory default configuration is defined in the Configuring Power-Up State section of Appendix C.
API Commands Appendix A *K - Change Calibration Keyword TYPE EXECUTION SYNTAX Calibration Immediate *Kkey Change the calibration keyword, where key is the keyword in the form of a 5digit number nnnnn. Therefore the password can be no longer than 5 characters. DESCRIPTION Note: This command is only for advanced users who perform their own calibration. It is not necessary for normal, everyday operation.
Appendix A API Commands *P - Adjust Calibration Card Pots TYPE EXECUTION SYNTAX Calibration Immediate *Pchan Select voltage level to be enabled for adjustment. Valid options for chan are: 01 - Enable -4.4 Volt Source on calibration card, 02 - Enable +4.4 Volt Source on calibration card, and 03 - Select 0 Volts GND. DESCRIPTION Note: This command is only for advanced users who perform their own calibration. It is not necessary for normal, everyday operation.
API Commands Appendix A *R - Power-On Reset TYPE EXECUTION SYNTAX DESCRIPTION System Immediate *R Power-On Reset. Equivalent to a hardware reset. The Power-On Reset (*R) command has the same effect on the unit as removing and re-applying power. All data in data buffers and configuration are erased. Note: Because the *R command performs a full power-on reset, 3 or 4 seconds are required before you can communicate with the unit.
Appendix A API Commands *S - Power-Up Settings TYPE EXECUTION SYNTAX System Immediate *Smode Specify power-up configuration mode. Valid options for mode are: 0 - Power up under last known configuration (default). 1 - Power up under factory default configuration. DESCRIPTION With the Power-Up Settings (*S) command, specifying the mode to be 0 will cause the unit to load its last known configuration when it is powered on or when the Power-On Reset (*R) command is issued.
API Commands Appendix A *T - Time Stamping TYPE EXECUTION SYNTAX System Immediate *Tstate Specify whether or not time stamping will be enabled. Valid options for state are: 0 - Disable time stamping (default), 1 - Enable absolute time stamping, and 2 - Enable relative time stamping. DESCRIPTION The Time Stamping (*T) command, when enabled, will append a time/date time stamp to each scan being sent by the unit to the controller: If absolute time stamping is enabled, the format is HH:MM:SS.
Appendix A API Commands A - Assign Alarm Output TYPE EXECUTION SYNTAX System Deferred Achans, output A? Set alarm condition where chans is the channel(s) to assign to the digital output. chans may be in two forms: chan (for a single channel where 1 < chan < max) or first-last (for a range of channels where 1 < first < last < max), where max = 128 for ChartScan/1400. output is the digital output number with which to associate the channel(s), where 0 < output < 32.
API Commands Appendix A A# - Alarm Stamping TYPE EXECUTION SYNTAX System Immediate A#state Specify whether or not alarm stamping will be enabled. Valid options for state are: 0 - Disable alarm stamping (default), and 1 - Enable alarm stamping. DESCRIPTION The Alarm Stamping (A#) command (when enabled) will append the alarm state to the end of each scan as it occurs: The alarm status consists of 32 bits: A31 through A00, each with a 1 signifying alarm on, or a 0 signifying alarm off.
Appendix A API Commands C - Configure Channels TYPE EXECUTION SYNTAX Channel Deferred Cchans, type [, [lowsp], [highsp], [hyst] ] C? Configure the channels for the master unit and its slave units. chans and type are required arguments, while lowsp, highsp and hyst are optional. chans may be in two forms: chan (for a single channel where 1 < chan < max) or first-last (for a range of channels where 1 < first < last < max), where max = 128 for ChartScan/1400. The chassis is chan = 0.
API Commands Appendix A Note: Specifying a reserved type will cause an error. Note: Because the Configure Channels (C) command is a deferred command, the channel(s) will not actually be configured until the Execute (X) command is processed. Since the configuring of channels takes a good deal of processor time, as many Configure Channels (C) commands as possible, should be placed on one command line. This will avoid unnecessary processing time when configuring many channels.
Appendix A API Commands EXAMPLE PRINT#1, “OUTPUT07; F0,0X” PRINT#1, “OUTPUT07;*C” PRINT#1,"OUTPUT07;C1,1,-100.0, 100.0, 0.5" PRINT#1,"OUTPUT07;C33-34,11" PRINT#1,"OUTPUT07;C65,2" PRINT#1,"OUTPUT07;X" PRINT#1,"OUTPUT07; U13X" PRINT#1,"ENTER07" INPUT A$ ‘ Set Data Format to Engineering Units, degrees C ‘ Clear current channel configuration ‘ Configure channel for T/C type J with low setpoint of 100.0 °C, high setpoint of 100.0 °C and hysteresis of 0.
API Commands Appendix A C# - Select Card TYPE EXECUTION SYNTAX Calibration Immediate C#card Select the card from which subsequent QC? and U12 interrogation will retrieve information. Without optional Relay Card Valid options for card are: 0 - Selects the chassis; 1, 2, 3, or 4 - Selects the card in corresponding slot of the main unit (with 1 being the bottom slot); and 5, 6, 7, or 8 - Selects the corresponding slot on the expansion chassis (with slot 5 being the bottom slot of the expansion chassis.
Appendix A API Commands D# - Set Relay Make Time System Deferred TYPE EXECUTION SYNTAX D#make Specify how long to wait after closing a channel relay before reading valid data, where make is the number of 520.833-microsecond intervals. DESCRIPTION The Set Relay Make Time (D#) command allows the user to increase the delay between closing a relay and reading valid channel data. The system powerup default is: make = 6 = 3.125 milliseconds.
API Commands Appendix A E - End Calibration Mode TYPE EXECUTION SYNTAX DESCRIPTION Calibration Immediate E Terminate Calibration Mode Note: This command is only for advanced users who perform their own calibration. It is not necessary for normal, everyday operation. To use this command the unit must be in Calibration Mode. The End Calibration Mode (E) command is then used to take the unit out of Calibration Mode.
Appendix A API Commands E? - Error Status Query TYPE EXECUTION SYNTAX System Immediate E? Returns present error condition of the unit with one of the following error codes: E000 - No error has occurred. E001 - Invalid device dependent command (IDDC). E002 - Invalid device dependent command option (IDDCO). E004 - Channel configuration error. E008 - Calibration error. E016 - Trigger overrun. E032 - Open T/C or Range Error. E128 - Command conflict error.
API Commands Appendix A F - Set Data Format TYPE EXECUTION SYNTAX System Deferred Fengr, format F? Configure the input and output formats. engr converts the raw data to the engineering units with which you prefer to work. Valid options are: 0 - °C, 1 - °F, 2 - °R, 3 - °K, and 4 Volts. °C is the default engineering unit. format places the readings in a format with which you prefer to work.
Appendix A API Commands Data Output Formats Data Type Temperature Volts Time/Date Absolute Relative Timebase Engineering Units xxxx.xx °C xxxx.xx °F xxxx.xx °R xxxx.xx °K +xx.xxxxxxxxx hh:mm:ss.mil, MM/DD/YY hh:mm:ss.mil, DDDDDDDD hh:mm:ss.t Binary High Byte / Low Byte Low Byte / High Byte Counts H/L L/H ±xxxxx H/L hmstMDY L/H ±xxxxx hh:mm:ss.mil, MM/DD/YY hh:mm:ss.
API Commands Appendix A EXAMPLES PRINT#1, “OUTPUT07:F0,0X” PRINT#1,“OUTPUT07;C1, 1, -100.0, 100.0, 1.0X” PRINT#1, “OUTPUT07; U4X” PRINT#1, “ENTERO7" LINE INPUT #2, A$ PRINT A$ PRINT #1, “OUTPUT07;F1,1X” PRINT#1,“OUTPUT07;C1, 1, -100.0, 100.0, 1.
Appendix A API Commands F# - Set Burst Mode Frequency TYPE EXECUTION SYNTAX System Deferred F#freq Select burst mode sampling frequency where freq is a real number and where 38.5 < freq < 20000.0 Hertz (default). DESCRIPTION The Set Burst Mode Frequency (F#) command is used to select the channel sampling frequency when in the High-speed, single-channel mode (burst mode). See Measuring Modes section of Appendix C for more information.
API Commands Appendix A G - Calibrate Channel Gain TYPE EXECUTION SYNTAX Calibration Immediate Gchan, type Calibrate the correction gain constants for given option card where chan is the channel number such that 1 < chan < max, where max = 128 for ChartScan/1400. The chassis is chan = 0. type is the channel type. DESCRIPTION Note: This command is only for advanced users who perform their own calibration. It is not necessary for normal, everyday operation.
Appendix A API Commands H - Calibrate Channel Offset TYPE EXECUTION SYNTAX Calibration Immediate Hchan Calibrate the correction offset constants for given option card where chan is the channel number such that 1 < chan < max, where max = 128 for ChartScan/1400. The chassis is chan = 0. DESCRIPTION Note: This command is only for advanced users who perform their own calibration. It is not necessary for normal, everyday operation.
API Commands Appendix A I - Set Scan Interval TYPE EXECUTION SYNTAX Acquisition Deferred Inorm, acq I? Set the two configurable scan intervals of the unit where norm and acq are the normal and acquisition scan intervals which have the form: hh:mm:ss.t where hh is hours, mm is minutes, ss is seconds, and t is tenths of a second. Query scan interval selection.
Appendix A API Commands I# - Digital Input Stamping TYPE EXECUTION SYNTAX System Deferred I#state Specifies digital input stamping as enabled,or disabled. state may have either of the following values: the default of 0, which disables digital input stamping, or 1 to enable digital stamping. DESCRIPTION The Digital Input Stamping (I#) command, when enabled, will append the digital input state to the end of each scan as it occurs in real time. The digital input state consists of 8 bits (I8 through I1).
API Commands Appendix A J - Calibrate Cold Junction Offset TYPE EXECUTION SYNTAX Calibration Immediate Jchan, type, temp Calibrate the cold-junction offsets for cold-junction compensation of the thermocouple signals where chan is the channel number such that 1 < chan < max, where max = 128 for ChartScan/1400. type is the thermocouple channel type. temp is the reference temperature currently being applied to the selected channel, with the form nnn.n in degrees º C.
Appendix A API Commands K - Enter Calibration Mode TYPE EXECUTION SYNTAX Calibration Immediate Kkey K? Enter Calibration Mode if the keyword (or password) is correct, where key is the keyword in the form of a 5-digit number nnnnn. Therefore the password can be no longer than 5 characters. Query Kkey as defined above. DESCRIPTION Note: Calibration should only be performed by a qualified metrology lab. If necessary contact the factory for assistance.
API Commands Appendix A L - Set Trigger Level TYPE EXECUTION SYNTAX Channel Deferred Lchan, level, hyst L? Sets the level against which the testing of channel readings should be performed where chan is the channel number such that 1 < chan < max, where max = 128 for ChartScan/1400. level is the level against which the readings are tested to determine if the level has been exceeded. hyst is the hysteresis level.
Appendix A API Commands M - Set SRQ Mask TYPE EXECUTION SYNTAX System Deferred Mmask M? Use the IEEE 488 Service Request (SRQ) mechanism to inform the IEEE 488 bus controller of certain conditions, where mask is in the form of the number nnn such that 000 < nnn < 255 is summed from the following conditions: 000 - Power-on default mask value 008 - SRQ On Scan Available 001 - SRQ On Alarm 016 - SRQ On Message Available 002 - SRQ On Trigger Event 032 - SRQ On Event Detected 004 - SRQ On Ready 128 - SRQ O
API Commands Appendix A M# - Set Measuring Mode System Deferred TYPE EXECUTION SYNTAX M#mode Specify measuring mode. Valid options for mode are: 0 - Line cycle integration / high-speed multi-channel mode, and 1 - Single channel highspeed burst mode. DESCRIPTION The Set Measuring Mode (M#) command selects one of the two internal measuring modes supported by the ChartScan/1400 units: Normal Mode (for Line Cycle Integration and High-Speed Multi-Channel applications). Normal mode is the system default.
Appendix A API Commands N - Set Event Mask TYPE EXECUTION SYNTAX System Deferred Nmask N? Directly sets the Event Status Enable Register (ESE) where mask is in the form of the number nnn such that 000 < nnn < 255 is summed from the following conditions: 000 - Clear event mask 016 - Execution Error 001 - Acquisition complete 032 - Command Error 002 - Stop Event 064 - Buffer 75% Full 004 - Query Error 128 - Power On 008 - Device Dependent Error Query the Event mask.
API Commands Appendix A O - Set Digital Outputs System Immediate TYPE EXECUTION SYNTAX Obank1, bank2, bank3, bank4 O? Set any of the 32 digital outputs (separated into four 8-bit banks) to a specified setting, where bankn (for n = 1, 2, 3, 4) is an argument in the form of the number nnn such that 000 < nnn < 255 when converted to binary format represents the desired settings for the 8-bit bank. Query current state of digital output.
Appendix A API Commands P - Program Trigger Times TYPE EXECUTION SYNTAX Channel Deferred Pstart, stop P? Set the trigger start and/or stop times for an acquisition configured for start and/or stop on absolute time, where start and stop are in the standard time/date stamp format: HH:MM:SS:T,mm/dd/yy where H is hours, MM is minutes, SS is seconds, T is tenths of a second, mm is month, dd is day, and yy is year.
API Commands Appendix A ? - Query TYPE EXECUTION SYNTAX DESCRIPTION System Immediate ? Query the present configuration or mode of the command preceding the ? Most commands have a corresponding Query (?) command formed by appending a question mark (?) to the command letter. Query commands place their responses into the output queue until the controller retrieves them. They respond with the present configuration or mode of a previously executed command.
Appendix A API Commands Q - Set Query Terminator TYPE EXECUTION SYNTAX System Deferred Set the query terminators with the following parameters: resp is the response terminator, hll is the channel terminator, scan is the terminator which follows each scan output, and block is the terminator which follows each trigger block output. sep determines whether or not a separator character should be used.
API Commands Appendix A The following table summarizes terminator usage with all possible commands in ASCII mode (no terminators are used in binary mode), where X indicates that the terminator is asserted at the end of the response, O indicates that the terminator is asserted within the response to separate channel and scan readings, and a blank cell indicates that the terminator does not affect the command: Command Argument resp R1X R2X R3X R#chanX R#first-lastX U4X U5X U13X All others hll scan O O
Appendix A API Commands QC? - Query Card Data TYPE EXECUTION SYNTAX Calibration Immediate QC? Read back card ID and calibration information from the card previously selected by the Select Card (C#) command. DESCRIPTION Note: This command is only for advanced users who perform their own calibration. It is not necessary for normal, everyday operation.
API Commands A-50 Appendix A ChartScan User’s Manual
Appendix A API Commands R - Read Buffered Data TYPE EXECUTION SYNTAX Buffer Immediate Rtype R? Read scan data from the acquisition buffer where type is the type of data request being made. Valid options for type are: 1 - Read the oldest scan currently residing in the acquisition buffer, 2 - Read the oldest complete trigger block currently residing in the acquisition buffer, and 3 - Read all the scan data that currently resides in the acquisition buffer. Query the contents of the data buffer.
API Commands Appendix A R# - Read Last Readings TYPE EXECUTION SYNTAX System Immediate R#chans Queries the last readings from the HLL Registers for specified channels. chans may be in two forms: chan (for a single channel where 1 < chan < max), or first-last (for a range of channels where 1 < first < last < max), where max = 128 for ChartScan/1400. DESCRIPTION The Read Last Readings (R#) command will return a subset of the Query Last (U13) command.
Appendix A API Commands S - Set Real Time Clock TYPE EXECUTION SYNTAX System Immediate Stime S? Set the unit’s internal real-time clock where time is in the standard time/date stamp format: HH:MM:SS:T,mm/dd/yy where H is hours, MM is minutes, SS is seconds, T is tenths of a second, mm is month, dd is day, and yy is year. Query Stime as defined above. DESCRIPTION The Set Real Time Clock (S) command is used to set the unit’s internal real-time clock.
API Commands Appendix A T - Set Trigger Configuration TYPE EXECUTION SYNTAX Acquisition Deferred Tstart, stop, re-arm, sync T? Configure an acquisition of scan data with the following parameters: start is the start event stop is the stop event re-arm determines if the unit should continue acquiring after the first acquisition completes, where 1 is on and 0 is off. sync determines if acquisition events should be synchronized with the internal timebases, where 1 is on and 0 is off.
Appendix A API Commands (1) The first parameter, start, defines the event that is to take place in order for the unit to begin acquiring scans. This event is referred to as the Start Trigger. When the unit has recognized that a Start Trigger has been encountered, it will begin acquiring scans at that point. The first of these scans, the Start Trigger scan, will be time/date stamped for later reference.
API Commands Appendix A U - User Status TYPE EXECUTION SYNTAX System Immediate Ureq Request information about various internal conditions of the unit where req refers to one of the following request types: 0 - Query and clear the Event Status Register (ESR) 1 - Query the Status Byte Register (STB) 2 - Query and clear Calibration Status Register (CSR) 3 - Query system settings 4 - Query current High/Low/Last registers 5 - Query and clear current High/Low/Last 6 - Query the Buffer Status String 7 - Query
Appendix A API Commands Contents of Calibration Status Register (CSR) U3: Query the current system settings. This command responds with the equivalent of the following: F?I?L?P?Q?S?T?Y? U4: Reads the current High/Low/Last data for all configured channels. Refer to the Data Output Format section of Appendix C for the format of the High/Low/Last response. U5: Reads and resets the High/Low/Last data.
API Commands Appendix A • Stop Scan Pointer: This field represents the location in the current read block that the stop event occurred. This pointer will always be relative to the trigger point with the trigger point always oriented at location 0. Since the stop event must always occur after the trigger event this pointer will always be greater than 0. If the stop event has not yet occurred at the time of the U6 query, this field will have the value of -0999999.
Appendix A API Commands U17: This command computes and returns the root mean square (RMS) value of the last completed burst mode acquisition. U18: Queries the acquisition states and various system flags. The response nnn has the following integer form: 000 ≤ nnn ≤ 255.
API Commands Appendix A V - Set User Terminator TYPE EXECUTION SYNTAX System Deferred Vval V? Set the User Terminator value to any character whose numeric value (ASCII value) val is in the range 0 to 255. Query the present user terminator value. DESCRIPTION The Set User Terminator (V) command is used to set the User Terminator value to any character whose numeric value (ASCII value) is in the range 0 to 255.
Appendix A API Commands W# - Set Average Weight TYPE EXECUTION SYNTAX System Deferred W#wt Specify the number of samples to average in the Normal mode, where wt is the average weight. Valid options for wt are: 1, 2, 4, 8, 16, 32, 64, 128, and 256 (with 32 being the default value). DESCRIPTION Normal mode is used for line cycle integration for noise filtering, or for high-speed multiple channel use when noise is not a problem.
API Commands Appendix A X - Execute TYPE EXECUTION SYNTAX DESCRIPTION System Immediate X Execute preceding command string. Most commands are interpreted and processed as they are received but are not executed until the Execute (X) command is issued. Commands sent without an X are stored in an internal buffer and are not executed until an X is received. While a command line is being interpreted, the front panel LEDs will not be updated. These LEDs will only be updated when the unit is in a ready state.
Appendix A API Commands Y - Set Counts, or Select Blocks TYPE EXECUTION SYNTAX Acquisition Deferred Ypre,post, stop Y0,count,0 Y? When in Normal mode of data acquisition, set acquisition counts where pre is the pre-trigger count, post is the post-trigger count and stop is the post-stop count. When in High-speed, single-channel mode (burst mode), set count; where count is the number of 256 sample blocks to be collected Query current acquisition count selections.
Appendix B Configuration Aspects for Programmers λ λ λ Reference Notes: If you are not familiar with programming you will probably gain more understanding of the programrelated portions of this appendix by first reviewing Appendix A, API Commands and Appendix D, ChartScan Program Examples. Hardware configuration for RS-232 and IEEE 488 are discussed in Chapter 3. Configuration for Net232 Ethernet/RS-232 Converter is discussed in the Net232 User’s Guide, part number 1037-0921.
Configuration Aspects for Programmers Appendix B Memory Allocation Each ChartScan comes equipped with 256 KB memory. There are three options for additional memory: 1 Mbyte, 4 Mbytes, and 8 Mbytes. The memory modules are located in SIMM sockets JP201 and/or JP202 on the microprocessor board. Refer to Chapter 3 if you intend to add or remove memory modules. Regardless of the memory option used, ChartScan will automatically allocate its memory for optimal use according to its current configuration.
Appendix B Configuration Aspects for Programmers Measuring Modes Overview You can select either of two scanning modes for ChartScan, 1) Normal mode, or 2) High-speed, single-channel mode (Burst Mode). Mode “Average weight” Setting 16, 32, 64, 128, or 256 1, 2, 4, or 8 Normal High-speed, single-channel not selectable ChartScan Measuring Modes Application Recommended for AC noise rejection.
Configuration Aspects for Programmers Appendix B Normal Mode ChartScan has the ability to reject noise resulting from AC line pick-up when an Average weight setting of 16 or more measurements per line cycle is used. This noise rejection factor is important, as it allows for higher accuracy.
Appendix B Configuration Aspects for Programmers High-Speed, Single-Channel Mode (Burst Mode) The High-speed, single-channel mode, also known as burst mode, is used for post-acquisition waveform analysis of AC and DC voltages. In this mode, ChartScan can sample from 38.5 Hz to 20.0 kHz, and store the data in memory. Note that ChartScan’s memory can be expanded up to 8 Mbytes.
Configuration Aspects for Programmers Appendix B Configuration Requirements ChartScan does not scan channels on its initial power-up. Even though most user-set configuration states have associated defaults, you must configure a few items before scanning begins. For ChartScan to begin scanning, the controlling computer must perform two operations: (1) Configure each channel, and (2) select the channels that are to be included in the scan. These operations are illustrated in the following figure.
Appendix B Configuration Aspects for Programmers PRINT#1,"OUTPUT07; C1-4,1X" ‘ Configure master channels 1-4 with Type JTC PRINT#1,"OUTPUT07;I00:01:00.0,00:00:01.0X" ‘ Configure normal timebase to 1 minute, acquisition timebase to 1 second PRINT#1,"OUTPUT07;Y100,1100,0X" ‘ Set pre-trigger scan count to 100 and post-trigger to 1100 scans PRINT#1,"OUTPUT07;T1,8,0,0X" ‘ Configure start event to trigger on command and stop event to stop posttrigger count.
Configuration Aspects for Programmers Appendix B CSN14/TC/P Configuring Thermocouple Channels Begin configuring input channels by first specifying the channel type. When the CSN14/TC/P signal conditioning module is used, 16 differential thermocouple inputs are provided. In configuring thermocouple (T/C) channels, all that is required is to assign each channel to a particular T/C type. Support for B, E, J, K, R, S, T and N (14 and 28 gauge) thermocouple types are standard.
Appendix B Configuration Aspects for Programmers CSN14/HV/S Configuring High Volts Channels When the CSN14/HV/S signal conditioning module is used, ChartScan measures high voltages providing a programmable range per channel. To configure the channels on a CSN14/HV/S, use the Configure Channel (C) command to assign a range to each channel on the signal conditioning module. Channels not included in the channel scan do not have to be configured.
Configuration Aspects for Programmers Appendix B The I command is used to set these two scan intervals. For example, the following command: I00:00:10.0,00:00:00.1 would set the scan interval to once every 10 seconds and set the post-trigger scan interval to once every 0.1 seconds. As mentioned earlier, the scan interval can be set to run as fast as the current configuration will allow. This is referred to as fast mode. Each of the two scan intervals can be configured as such by specifying 00:00:00.
Appendix B Configuration Aspects for Programmers Pre-Trigger State The Pre-Trigger state is defined as the period after ChartScan has been configured to collect an acquisition (via the Trigger Configuration T command), and before the actual Trigger event occurs. While the unit is in this state, the TRIGGER LED will flash. As in any other acquisition state, the alarms and their associated outputs will be updated at the fastest rate possible under the current channel configuration.
Configuration Aspects for Programmers Appendix B To enable this functionality you must perform the following steps: 1. Set the first parameter of the Counts (Y) command to -1. If more than one transition cycle is desired, enable the Auto-Rearm flag of the Trigger Configuration command. If this is done, each transition cycle will be stored in its own Trigger Block within the buffer. 2. Set the timebase intervals for each event using the Timebase Interval (I) command. 3.
Appendix B Configuration Aspects for Programmers Post-Trigger State The Post-Trigger state is the period between the occurrence of the trigger event and the occurrence of the stop event. While the unit is in this state the TRIGGER LED will be on and the alarms and their associated outputs will be updated at the post-trigger scan rate. During the Post-Trigger state the unit will collect Post-Trigger data at the rate specified by the acquisition scan interval specified by the Scan Interval (I) command.
Configuration Aspects for Programmers Appendix B In order for an acquisition to take place, the unit must have a trigger event and can be assigned a Stop Event. This allows different stimuli to begin and end an acquisition. Note: If the trigger start event is level or alarm, at least one pre-trigger scan must be programmed to initiate scanning in order for ChartScan to recognize the event. External TTL (High or Low Level) Start and/or Stop Event.
Appendix B Configuration Aspects for Programmers Time Stamping (*T) As mentioned in the previous sections, the contents of each scan contains one reading for each defined channel. Optionally, time stamping of each scan can be enabled with the *T command. *T1 enables absolute time stamping, *T2 enables relative time stamping, while *T0 disables time stamping. Refer to the *T command description for further details.
Configuration Aspects for Programmers Appendix B With Alarm Stamping: PRINT#1, “OUTPUT07;A#1X” ‘ Enable alarm stamping . ‘ Configure and start an acquisition PRINT#1, “OUTPUT07;R1X” ‘ Request the next scan in the buffer PRINT#1, “ENTER07” ‘ Retrieve it INPUT A$ ‘ ....+0234.20-0019.40+0001.40+0023.60 005 128 032 066 Digital Input Stamping (I#) Digital Input Stamping (I#) allows you to see whether a digital input was “active” or “inactive” at the time of the scan.
Appendix B Configuration Aspects for Programmers With Digital Input Stamping: PRINT#1, “OUTPUT07;I#1X” ‘ Enable digital input stamping . ‘ Configure and start an acquisition PRINT#1, “OUTPUT07;R1X” ‘ Request the next scan in the buffer PRINT#1, “ENTER07” ‘ Retrieve it INPUT A$ ....+0234.20-0019.40+0001.40+0023.60 036 000 The last six digits are the digital input stamping; however, the last three digits are not used, and will always appear as 000.
Configuration Aspects for Programmers Appendix B Acquisition Buffer, A Description Once scans are read from the buffer by the controlling computer, they are erased from ChartScan’s buffer. The acquisition buffer is a FIFO (First-In First-Out) buffer. In other words, the oldest data to be written into the buffer is the first data to be read from the buffer when a read operation is performed. The buffer may be broken up into one or more “trigger blocks.
Appendix B Configuration Aspects for Programmers This response indicates that the first available scan is -0000076, which is a pre-trigger scan. This scan can be retrieved as follows: PRINT#1,”OUTPUT 07;R1X” ‘ Get the -0000076 scan PRINT#1,”ENTER 07” ‘ Get the scan INPUT A$ ‘ Screen shows (4 channels configured) … +1234.50-0234.20+0984.00+0323.
Configuration Aspects for Programmers Appendix B Multiple Trigger Blocks Through the Auto-Rearm capability of ChartScan, it is possible to capture more than one trigger block in the unit’s Acquisition Buffer. Each trigger block would contain one and only one trigger point. These trigger blocks are stacked end-to-end in the buffer; as the last reading of the first trigger block is read by the controller, the next scan to be read will be from the second trigger block.
Appendix B Configuration Aspects for Programmers Acquisition Buffer Interrogation Note: In the following sections “current trigger block” always refers to the trigger block that is currently being read. The current status of the acquisition buffer may be interrogated at any time by issuing the Buffer Status String (U6) command. As mentioned earlier, the U6 command is a user query command which will return information regarding the current state of the acquisition buffer.
Configuration Aspects for Programmers Appendix B 7 - End Scan Pointer This field represents the location in the current trigger block that the end scan occurred. This pointer will always be relative to the trigger point. Since the end scan must always occur after the trigger event this pointer will always be greater than 0. If the end scan has not yet occurred at the time of the U6 query, this field will have the value of -0999999.
Appendix B Configuration Aspects for Programmers The following figures and table illustrate a case in which an acquisition has been triggered, the stop event and end scan have occurred, and the buffer contains several trigger blocks. Field 1 2 3 4 5 Response 0000007 0020567 -00000100 12:01:43.100, 03/01/97 The trigger time stamp is defined as indicated. 00000100 The stop event pointer is defined as scan number 100. The stop event time is defined as indicated.
Configuration Aspects for Programmers Appendix B Reading the Acquisition Buffer The three previous sections briefly discussed how the acquisition buffer may be accessed and read. In this section the methods by which the acquisition buffer is read will be discussed in more detail. As mentioned earlier, the Acquisition Buffer is organized as a FIFO (First In, First Out). As such all data read from the Acquisition Buffer will be the oldest available data.
Appendix B Configuration Aspects for Programmers The R2 command will read the oldest available trigger block in the Acquisition Buffer. For instance, continuing with the previous example: PRINT#1,"OUTPUT07; U6X" PRINT#1,"ENTER07" INPUT A$ PRINT A$ ‘ Request the current status of the Acquisition Buffer ‘ Retrieve it. ‘ Screen shows... 0000006,0020215,-00000099,12:51:43.100,03/24/97,00000100,01:53:01.
Configuration Aspects for Programmers Appendix B Configuring Alarms ChartScan can produce an internal event when the value of a channel is outside of user-defined limits. These “alarm events” can be used as trigger or stop events, or as a stimulus for TTL-level signals on ChartScan’s rear panel. To use alarms the channels in question must be part of the channel scan. The alarms will become active and monitored only after an acquisition has been configured and armed, and only at the programmed scan rate.
Appendix B Configuration Aspects for Programmers As mentioned before, more than one channel can be assigned to any given output bit. For example, if the following statement were appended to the above example, then either channel 2 or channel 3 will set digital output #2.
Configuration Aspects for Programmers Appendix B Digital I/O Operation As shown in the DB50 pinout in the Installation and Configuration section, ChartScan has digital I/O pins for eight inputs and thirty-two outputs (see note). The digital outputs can be controlled either automatically via the alarm settings or with programming using the Set Digital Outputs (O) command. To determine the digital output state, use the O? command.
Appendix C Registers, Data Formats, & Queries Reference Note: If you are not familiar with programming you will probably gain more understanding of the program-related portions of this appendix by first reviewing Appendix A, API Commands and Appendix D, ChartScan Program Examples.
Registers, Data Formats, & Queries Appendix C Using High/Low/Last (HLL) Registers The High/Low/Last (HLL) registers are an alternative method of getting channel data from the ChartScan unit. The HLL registers are updated during an acquisition at the current programmed scan rate. At any time, the HLL registers can be queried for channel values without affecting the buffered data. The returned data is in the engineering unit and format (ASCII or binary) defined by the user.
Appendix C Registers, Data Formats, & Queries You can use the Query Terminator (Q) command to specify a response terminator between each channel of the HLL response. Use the Format (F) command to specify the output format of the HLL Registers. The following examples show how to use these commands to configure and query the HLL Registers. Example 1: Example 1 shows how to configure and query all the HLL registers and how the HLL terminator can be used to control the flow of the HLL response output.
Registers, Data Formats, & Queries Appendix C Example 3: Example shows how to read only the Last readings. PRINT#1,"OUTPUT07 F0,0 Q1,1,0,0, 0X" ‘ ‘ PRINT#1,"OUTPUT07 C1-4,1X" ‘ . . . ‘ PRINT#1,"OUTPUT07; U13X" ‘ PRINT#1,"ENTER07" ‘ INPUT A$ ‘ PRINT A$ +0950.30 PRINT#1,"ENTER07" ‘ INPUT A$ ‘ PRINT A$ +0250.60 PRINT#1,"ENTER07" ‘ INPUT A$ ‘ PRINT A$ -0050.80 PRINT#1,"ENTER07" ‘ INPUT A$ ‘ PRINT A$ +0010.
Appendix C Registers, Data Formats, & Queries Example 6: Example 6 shows how to retrieve the Last readings for a subset of the configured channels. PRINT#1,"OUTPUT07 F0,0 Q1,1,0,0,0X" PRINT#1,"OUTPUT07 C1-4,1X" . . . ‘ Set format to ASCII degrees C with ‘ HLL terminator ‘ of CR LF/EOI ‘ Configure four channel (no setpoints) ‘ ‘ ‘ ‘ PRINT#1,"OUTPUT07; R#2-3X" PRINT#1,"ENTER07" INPUT A$ PRINT A$ +0250.60 PRINT#1,"ENTER07" INPUT A$ PRINT A$ -0049.
Registers, Data Formats, & Queries Appendix C Examples: PRINT#1,"OUTPUT07; F0,0X" PRINT#1,"OUTPUT07;F1,1X" PRINT#1,"OUTPUT07;F3,3X" ‘ ‘ ‘ ‘ ‘ ‘ ‘ ‘ Interpret C and L command parameters as Engineering Units — Degrees C Interpret C and L command parameters as Engineering Units (Even though binary is specified) Degrees F. Interpret C and L command parameters as Counts (Counts format is specified) (Note that Engr.
Appendix C Registers, Data Formats, & Queries Centigrade: Fahrenheit : Rankine: Kelvin : -3276.7 < C < +3276.7 F = (9/5)C + 32 R = (9/5)C + 491.69 K = C + 273.16 Note: R = F + 459.69 For channels configured as thermocouples, all ASCII readings will be returned in the format which corresponds with the engineering unit selected. The formats are as follows, where X is an ASCII digit. Centigrade : Fahrenheit : Rankine : Kelvin : XXXX.XX XXXX.XX XXXX.XX XXXX.
Registers, Data Formats, & Queries Appendix C Scan Interval Scan Interval formats have the following ASCII format: hh:mm:ss.t An example: 01:02:03.5 = Scan interval of 1 hour, 2 minutes and 3.5 seconds Binary Data Format Only High/Low/Last (HLL) register and acquisition output data, may be in binary format. Binary formatted data can be output in either highbyte/lowbyte or lowbyte/highbyte format.
Appendix C Registers, Data Formats, & Queries Configuring Power-Up State ChartScan has an internally stored factory default configuration that can be recalled at any time. You can program the ChartScan to power-up in a “user-defined” state, or if desired, can configure the unit to power-up with the default configuration. During normal operations the factory defaults may be recalled by issuing the Restore Factory Defaults (*F) command.
Registers, Data Formats, & Queries Appendix C Queries ChartScan provides many ways to query the unit for specific information. Most commands have a corresponding query command which responds with the configuration or mode of a previously executed command. In addition, the U Status commands can be used at any time (without interfering with normal operation) to return information about various ChartScan conditions.
Appendix C Registers, Data Formats, & Queries U Commands and Descriptions U0 U1 U2 U3 U4 U5 U6 U7 U8 U9 U10 U11 U12 U13 U14 U15 U16 U17 U18 Causes ChartScan to return a fixed-length status message string. The status message shows the current options in use for each command. Causes ChartScan to return a decimal number from 000 to 255. This number is the decimal equivalent of the binary information on the digital input lines (on the rear panel, card edge digital I/O connector).
Registers, Data Formats, & Queries Appendix C Register Chart Status and Event Reporting Registers Command Type Register Access Read Write Clear Read/Clear U2 N/A U2 CSR Calibration Status Read/Clear E? N/A E? ESC Error Source Read/Clear U0 N/A U0 ESR Event Status Read U1 N/A N/A STB (SPOLL) Status Byte Register Chart Mask Registers Command Type Register Access Read Write Clear Read/Write/ N? N0 Nmmm ESE Clear (See Event Status Note) Enable Read/Write/ M? M0 Mmmm SRE Clear (See Service Request Note) Enable
Appendix C ChartScan User’s Manual Registers, Data Formats, & Queries C-13
Registers, Data Formats, & Queries Appendix C Calibration Status Register (U2 Command) The calibration status register indicates which calibration errors, if any have occurred. The individual errors are described in the U2 command. Any calibration error will be mapped into the Calibration Status which maps to the Calibration Error bit in the Error Source Register. Error Source Register (E? Command) The error source register indicates which errors, if any, have occurred.
Appendix C Registers, Data Formats, & Queries Status Byte Register The acquisition device sets the Message Available bit (MAV) in the Status Byte Register to determine if data can be read by the controller. This is the only status reporting register which requires RS-232 interface users to use a different read command than IEEE 488 interface users.
Registers, Data Formats, & Queries Appendix C Bit Location Description Set, Clear and Descriptive Information DI01 Alarm Set when the scanning device has sensed a valid alarm condition. The alarm is cleared when the alarm condition no longer exists. DI02 Trigger Set when ChartScan has detected the trigger condition and will be cleared when the acquisition is complete or the trigger has been reconfigured. Detected DI03 Ready Set when ChartScan is ready to process another command.
Appendix C Registers, Data Formats, & Queries The ESB in the Serial Poll Status Register is also cleared by these operations. The Command Error, Execution Error and Device Dependent Error are also cleared with an Error Query (E?) command. Bit Location Description Set, Clear and Descriptive Information DI01 Alarm DI02 Trigger Detected Set when the acquisition system has sensed a valid alarm condition. The alarm is cleared when the alarm condition no longer exists.
Registers, Data Formats, & Queries Appendix C Trigger Latency Each trigger source has an associated latency. This is the time between the actual trigger and its recognition by the acquisition device. The following latency times are only representative of the time between when the trigger is detected and when the trigger has been processed. Hardware latency times and ISR servicing of other tasks at the time of the trigger event but before the trigger is detected are not accounted for.
Appendix C 1. Registers, Data Formats, & Queries IEEE 488 PRINT#1, “SPOLL 07" INPUT #2, S% IF (S% and 128 = 128) THEN PRINT “Buffer Overrun Occurred” ENDIF 2. IEEE 488 and RS-232 PRINT#1, “OUTPUT07; U1X” PRINT#1, “ENTER07" INPUT #2, S% IF (S% and 128 = 128) THEN PRINT “Buffer Overrun Occurred” ENDIF Buffer Overrun With One Trigger Block When only one trigger block is in the buffer, a buffer overrun will erase the entire pre-trigger.
Registers, Data Formats, & Queries Appendix C − Notes C-20 ChartScan User’s Manual
Appendix D ChartScan Program Examples Reference Note: You may find Appendix A useful while reading through these examples. Appendix A contains descriptions and examples of the Application Program Interface (API) Commands. Contents Overview ------------------------------------------------------------------------------------------------------------------------D-1 Reading HLL Status using HLL16.
ChartScan Program Examples Appendix D Reading HLL Status using HLL16.BAS The following program is HLL16.BAS in the EXAMPLES directory. It will configure 16 channels, collect the HLL (high/low/last) data, and post it on the screen. Although not necessary, it is good practice to reset the ChartScan at the beginning of your application by sending it the “*R” command then waiting a few seconds.
Appendix D ChartScan Program Examples Until another key is pressed to exit the loop, the U4 command is issued and the high/low/last data is collected. The OUTPUT command sends U4 to the device, the ENTER command requests the data, then the QuickBASIC’s LINE INPUT gets the data from the IEEE 488 driver and places it in the variable U$. The FOR loop extracts the data for the individual channels from the string U$ and places them on the screen.
ChartScan Program Examples Appendix D The T command sets up the trigger parameters for the acquisition. In this example, the start event is an ‘@’ character sent by the controller, and the stop event is also an ‘@’ character. The auto-rearm flag is set to 0 (off), so that the ChartScan will not re-arm itself for another acquisition after this acquisition is complete. The synchronization flag is also off, so the ChartScan will not re-synchronize itself to the trigger point when the start event begins.
Appendix D ChartScan Program Examples Acquiring Pre- & Post-Trigger Data at the Same Rate using FAST_ACQ.BAS The following program, FAST_ACQ.BAS, in the EXAMPLES directory will set up the ChartScan for fast acquisition then bring the values into the controller after the acquisition is complete. From a logic standpoint, the difference between this and SLOW_ACQ.BAS is that this program reads blocks of data instead of one scan at a time. This method is usually more efficient in case of fast scan intervals.
ChartScan Program Examples Appendix D Using the event status register command “UOX”, we now wait until the acquisition complete event which includes the stop event. WHILE (U% AND 1) <> 1 PRINT #1, “OUTPUT 07;U0X” PRINT #1, “ENTER 07" INPUT #2, U% WEND PRINT “The Acquisition is now complete” During or after the acquisition has been completed, the internal buffer can be queried for the amount of data available for transfer.
Appendix D ChartScan Program Examples After the C command is issued, the ChartScan is now completely armed for alarming. In our example, levels above 18 or below 1 will cause a system alarm. If the intent of the application was to use alarm levels to trigger an acquisition, only the following line would be required to arm the alarms to satisfy the trigger and/or stop events.
ChartScan Program Examples Appendix D Using the IEEE 488 SRQ with Alarms using ALAR2SRQ.BAS The following program, ALAR2SRQ.BAS, in the EXAMPLES directory will set up the alarm system of the ChartScan and then use the IEEE 488 Service Request signal to asynchronously service the event. Although not necessary, it is good practice to reset the ChartScan at the beginning of your application by sending it the “*R” command and then waiting a few seconds. CLS : PRINT “The ChartScan is resetting..
Appendix D ChartScan Program Examples The O? query command returns the following string representing all 4 ports digital output status. Oxxx, xxx, xxx, xxx AlarmHandler: LOCATE 5, 1 PRINT “An Alarm condition has been PRINT #1, “SPOLL 07" INPUT #2, S% PRINT #1, “OUTPUT 07;O?X” PRINT #1, “ENTER 07" LINE INPUT #2, A$ PRINT A$ A% = VAL(MID$(A$, 2, 3)) IF A% = 1 THEN PRINT “Alarm on CH1 IF A% = 2 THEN PRINT “Alarm on CH2 IF A% = 3 THEN PRINT “Alarm on CH1 RETURN detected..
ChartScan Program Examples PRINT PRINT PRINT WHILE PRINT WHILE “The ChartScan is currently collecting pre-trigger “The ChartScan has not been triggered..” “Hit a key to start a trigger event ..”: INKEY$ = “”: WEND #1, “output07;@X” (S% AND 2) <> 2 PRINT #1, “SPOLL 07" INPUT #2, S% Appendix D data..” WEND PRINT “A Start Trigger has been detected..” PRINT “Waiting for acquisition complete..
Appendix D ChartScan Program Examples Collecting Binary-Formatted HLL Data using BIN_HLL.BAS The following program, BIN_HLL.BAS, in the EXAMPLES directory will set up the ChartScan to collect High/Low/Last channel readings in a binary format rather than the default ASCII format. This is inherently faster than ASCII format, but the data must be deciphered after it is collected to yield temperature values.
ChartScan Program Examples Appendix D WHILE INKEY$ = "" PRINT #1, "OUTPUT 07;U4X" PRINT #1, "ENTER 07 #"; CHANNELS% * 20; " BUFFER "; S%; ":"; O%; " DMA" PRINT "High, Low and Last readings of all 32 channels :" 'Decode received data and print on screen in ASCII FOR i = 1 TO BYTES STEP 20 HIGH$ = STR$(CVI(MID$(READS, i, 2))) HOURh$ = STR$(ASC(MID$(READS, i + 2, 1))) MINh$ = STR$(ASC(MID$(READS, i + 3, 1))) SECh$ = STR$(ASC(MID$(READS, i + 4, 1))) TENTHh$ = STR$(ASC(MID$(READS, i + 5, 1))) MONh$ = STR$(ASC
Appendix D ChartScan Program Examples Using Auto-Rearm to Capture Multiple Trigger Blocks using BLK_ACQ.BAS The following program, BLK_ACQ.BAS, in the EXAMPLES directory will set up the ChartScan for autorearm, which rearms the unit for another trigger event as soon as the present acquisition has been completed. Although not necessary, it is good practice to reset the ChartScan at the beginning of your application by sending it the “*R” command and then waiting a few seconds.
ChartScan Program Examples Appendix D Using the U6 query, the controller gets the trigger block string, which, among other things, supplies the block complete flag, indicating the state of the present trigger block. The block is marked complete when the last post-stop scan is recorded into the buffer. PRINT “Waiting for completion of Block ”; i; “..
Appendix D ChartScan Program Examples 'find the pointer to DataBuffer$ for DMA transfer buffseg% = VARSEG(DataBuffer$) DX% = VARPTR(DataBuffer$) buffoff% = FNPEEKW(DX% + 2) 'Program the ChartScan to power on with Factory default PRINT #1, "CLEAR 07" PRINT #1, "OUTPUT 07;*S1X" 'Reset ChartScan and make sure it is ready CLS : PRINT SLEEP WHILE PRINT INPUT WEND PRINT "The ChartScan is resetting..
ChartScan Program Examples Appendix D 'Query the ChartScan for the # of scans available in the Buffer PRINT PRINT INPUT PRINT PRINT PRINT INPUT PRINT "An SRQ has been detected..
Appendix D ChartScan Program Examples Configure for High-Speed, Single-Channel Burst Mode using BURST.BAS BURST.BAS configures ChartScan for the High-Speed, Single-Channel (Burst) measuring mode, sets up an acquisition, waits for its completion and uploads the data in ASCII, as well as posts it on the screen. This program also stops in the event of a buffer overrun.
ChartScan Program Examples Appendix D 'Query the ChartScan for the # of 256 sample scans available in the Buffer PRINT #1, "OUTPUT 07;U6X" PRINT #1, "ENTER 07" LINE INPUT #2, U$ UA$ = MID$(U$, 9, 7) UA% = VAL(UA$) PRINT "The ChartScan collected "; UA%; " scans of data" 'Program terminators for LF EOI and a space between channels PRINT #1, "OUTPUT 07;V32X Q7,0,7,7,1X" 'Upload data one scan at a time from the ChartScan PRINT #1, "OUTPUT 07;R2X" FOR i = 1 TO UA% PRINT #1, "ENTER 07" INPUT #2, SCAN$ LOCATE
Appendix E Bus States, Bus Lines, and Data Transfer Aspects Bus State Bus Line 8 7 Data Transfer (DIO) Lines 6 5 4 3 2 1 Bus Management Lines Interface Clear IFC REN Remote Enable IEEE 488 Interface: Bus Management Lines Attention (&H04) ATN 0 0 0 0 0 1 0 0 End-Or-Identify (&H80) 1 0 0 0 0 0 0 0 Service Request (&H40) 0 1 0 0 0 0 0 0 IEEE 488 Interface: Handshake Lines Data Valid (&H08) DAV EOI SRQ NDAC NRFD 0 0 0 0 1 0 0 0 Not Data Accepted (&H10) 0 0 0 1
− Notes E-2 ChartScan User’s Manual
Appendix F ASCII Code Summary Decimal Values 00 to 63 – ACG, UCG & LAG Box Items Hexadecimal Value $41 65 Decimal Value A Bus Message (in center) ASCII Character 01 Addressed Command Group (ACG) $00 00 $01 NUL 01 $02 SOH GTL 08 $09 $08 BS 09 $0A HT GET 02 $03 STX 03 $04 ETX SDC 11 $0C 10 $0B LF 04 $05 EOT VT 05 $06 ENQ 12 $0D FF 06 $07 ACK PPD 14 $0F 13 $0E CR 07 BEL SO 15 SI TCT Universal Command Group (UCG) $10 16 $11 DLE 17 $12 DC1 LLO 24 $19 $18 CAN DC2 2
ASCII Code Summary Appendix F Decimal Values 64 to 127 – TAG & SCG Box Items Hexadecimal Value $41 65 Decimal Value A Bus Message (in center) ASCII Character 01 Talk Address Group (TAG) $40 64 $41 @ 00 $48 65 $42 A 01 72 $49 H 08 $50 02 73 $4A 09 80 $51 16 $58 J Q X K R Y L S Z M T [ N U \ V ] 79 O 15 86 $57 22 93 $5E 29 71 G 07 78 $4F 14 85 $56 21 92 $5D 28 70 $47 F 06 77 $4E 13 84 $55 20 91 $5C 27 69 $46 E 05 76 $4D 12 83 $54 19 90 $5B 26 68 $45 D 04
ASCII Code Summary Appendix F ASCII Code Details Decimal Values 00 to 31 – ACG & UCG Characteristics ASCII Control Codes (Decimal 00 to 31) Dec Value Hex Value ($ or &H) Character and Abbreviation Name Bus Message None Addressed Command Group (ACG) 00 00 Null 01 01 Start of Header Go To Local (GTL) Start of Text None None / NUL ^A / SOH ^B / STX 02 02 ^C / ETX 03 03 ^D / EOT 04 04 ^E / ENQ 05 05 ^F / ACK 06 06 ^G / BEL 07 07 ^H / BS 08 08 ^I / HT 09 09 ^J / LF 10 0A ^K / VT 11 0B ^L / FF 12
ASCII Code Summary Appendix F Decimal Values 00 to 31 – ACG & UCG Descriptions ASCII Control Codes (00 to 31) Dec Name Description Addressed Command Group (ACG) 00 Null (NUL) 01 Start of Header (SOH) Space filler character. Used in output timing for some device drivers. Marks beginning of message header. 02 Start of Text (STX) Marks beginning of data block (text). 03 End of Text (ETX) Marks end of data block (text). 04 End of Transmission (EOT) Marks end of transmission session.
ASCII Code Summary Appendix F Decimal Values 32 to 63 – LAG ASCII Character Set (Decimal 32 to 63) Dec Hex Character Name Listen Address Group (LAG) Space 32 20 33 21 34 22 35 23 36 24 37 25 38 26 39 27 40 28 41 29 42 2A 43 2B 44 2C 45 2D 46 2E 47 2F ! “ # $ % & ‘ ( ) * + , .
ASCII Code Summary Appendix F Decimal Values 64 to 95 – TAG ASCII Character Set (Decimal 64 to 95) Dec Hex Character Name Bus Message At Sign Bus address 00 Capital A Bus address 01 Talk Address Group (TAG) 64 40 65 41 66 42 67 43 68 44 69 45 70 46 71 47 72 48 73 49 74 4A 75 4B 76 4C 77 4D 78 4E 79 4F @ A B C D E F G H I J K L M N O Capital B Bus address 02 Capital C Bus address 03 Capital D Bus address 04 Capital E Bus address 05 Capital F Bus address 06
ASCII Code Summary Appendix F Decimal Values 96 to 127 – SCG ASCII Character Set (96 to 127) Dec Hex Character Name Secondary Command Group (SCG) Grave ’ 96 60 97 61 98 62 99 63 100 64 101 65 102 66 103 67 104 68 105 69 106 6A 107 6B 108 6C 109 6D a b c d e f g h I j k l m n o Lowercase A Bus Message Command 00 Command 01 Lowercase B Command 02 Lowercase C Command 03 Lowercase D Command 04 Lowercase E Command 05 Lowercase F Command 06 Lowercase G Command 07 Low
ASCII Code Summary − F-8 Appendix F Notes ChartScan User’s Manual
Appendix G ChartScan Error Messages At initial power-up, ChartScan performs automatic self-tests to ensure it is fully functional. Rear-panel LEDs indicate errors, if they occur. Possible error conditions and their corresponding indicator light patterns are shown in the following table. Any pattern not shown indicates an internal error that is not field-serviceable; in this case, contact the factory.
ChartScan Error Messages Appendix G the Set Scan Interval (I) command is issued during an acquisition (tstart 0). After execution of the Error Status Query, most error conditions are cleared. Error conditions may also be cleared by issuing a Clear Event Status (U0) command to the unit. The ERROR light will remain on until an E? (or U0) command is executed to clear the error condition.
Appendix H Abbreviations y * *CA *SC A/D ACG ACK ADC API ASCII ATN BEL BS CA CAN CCL CJC CMD CR CTS DAV DC1 DC2 DC3 DC4 DCD DCL DDE DEL DIO DLE DLL DMA DMM DSR DTR EM ENQ EOI EOL EOT ESC ETB ETX FCC FF FS GET GPIB GS GTL GUI H/W (bullet symbol) “and” (e.g. *SCy yCA) (asterisk symbol) “unasserted” (e.g.
Abbreviations − H-2 Appendix H Notes ChartScan User’s Manual
Index -A- -F- Abbreviations, Appendix H AC Voltage, Measuring of, 4-40 AC RMS Voltage, Measuring of, 4-40, 4-41 Alarms, 4-24, 4-33, 4-34, B-26 API Commands, see Appendix A ASCII Code Summary, see Appendix F Auto Re-arm, 4-42, 4-43 Front Panel, ChartScan, 3-2 Fuse, Replacement of, 3-4 -B- Interface Communications Card (IEEE 488), Option, 3-10 IEEE 488, 3-10, 3-11, 3-12 -MMemory Configuration of, 3-4 Expansion of, 3-4, 3-5 Write Enable/Disable, 3-6 -NNet232 Ethernet/RS-232 Converter (Option), 3-9 Burst
ChartScan User’s Manual
WARRANTY/DISCLAIMER OMEGA ENGINEERING, INC. warrants this unit to be free of defects in materials and workmanship for a period of 13 months from date of purchase. OMEGA Warranty adds an additional one (1) month grace period to the normal one (1) year product warranty to cover handling and shipping time. This ensures that OMEGA's customers receive maximum coverage on each product. If the unit should malfunction, it must be returned to the factory for evaluation.
TEMPERATURE ; ; ; ; ; Thermocouple, RTD & Thermistor Probes, Connectors, Panels & Assemblies Wire: Thermocouple, RTD & Thermistor Calibrators & Ice Point References Recorders, Controllers & Process Monitors Infrared Pyrometers PRESSURE, STRAIN AND FORCE ; ; ; ; Transducers & Strain Gauges Load Cells & Pressure Gauges Displacement Transducers Instrumentation & Accessories FLOW/LEVEL ; ; ; ; Rotameters, Gas Mass Flowmeters & Flow Computers Air Velocity Indicators Turbine/Paddlewheel Systems Totalizers &