
- OMEGA Engineering, Inc. Power Supply User's Guide


Page : 10
11.- ADJUSTMENT AND CALIBRATION PROCEDURE
11.1.- RTD MODELS
A decade box or RTD simulator is required.
1.- Check that the instrument is not powered.
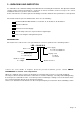
2.- Connect the RTD simulator or decade box to the signal input connector (See paragraph 8.3).
3.- Remove the rear cover taking off all the screws to obtain access to the control board.
(See page 7 paragraph 7).
4.- Power up the instrument with the appropriate power supply and wait until 3 minutes before to
start the adjust.
5.- Adjust the RTD simulator to generate the low signal indicated in TABLE-A.
6.- Display must shows the DISPLAY value indicated in TABLE-A, if not turn the trimmer PT1 located
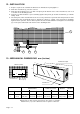
on the Signal Conditioner (See paragraph 10.1) until display shows the DISPLAY value.
7.- Adjust the RTD simulator to generate the high signal, see TABLE-B.
8.- Display must shows the DISPLAY value indicated in TABLE-B, if not turn the trimmer PT2 located
on the Signal Conditioner (See paragraph 10.1) until display shows the DISPLAY value.
9.- Repeat steps 5 to 8 until the two values are correct.
10.- Check that the linearity remains correct, testing some other points of the range.
11.2.- THERMOCOUPLE MODELS
A Thermocouple simulator with Cold Junction compensation is required.
1.- Check that the instrument is not powered.
2.- Connect the Thermocouple simulator to the signal input connector (See paragraph 8.4).
3.- Remove the rear cover taking off all the screws to obtain access to the control board.
(See page 7 paragraph 7).
4.- Power up the instrument with the appropriate power supply and wait until 3 minutes before to
start the adjust.
5.- Adjust the Thermocouple simulator to generate the low signal indicated in TABLE-A.
6.- Display must shows the DISPLAY value indicated in TABLE-A, if not turn the trimmer PT1located
on the Signal Conditioner (See paragraph 10.2) until display shows te correct value.
7.- Adjust the Thermocouple simulator to generate the high signal indicated in TABLE-B.
8.- Display must shows the DISPLAY value, if not turn the trimmer PT2 located on the Signal
Conditioner (See paragraph 10.2) until obtain the DISPLAY value.
9.- Repeat steps 5 to 8 until the low and the high signals are correct.
10.- Check that the linearity remains correct, testing some other points of the range.
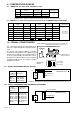
TABLE - A TABLE - B
MODEL LOW SIGNAL DISPLAY MODEL HIGH SIGNAL DISPLAY
M1 0°C 000.0 M1 600°C 600.0
M2 0°F 0000 M2 500°F 0500
M3 0°F 000.0 M3 200°F 200.0
J1 0°C 0000 J1 600°C 0600
J2 32°F 0032 J2 1000°F 1000
K1 0°C 0000 K1 1200°C 1200
K2 32°F 0032 K2 2000°F 2000
T1 0°C 0000 T1 400°C 0400
T2 0°F 0000 T2 400°F 0400
E1 0°C 0000 E1 600°C 0600
E2 32°F 0032 E2 1200°F 1200
R1 300°C 0300 R1 1700°C 1700
R2 32°F 0032 R2 3100°F 3100
S1 200°C 0200 S1 1700°C 1700
S2 32°F 0032 S2 3100°F 3100
L1 0°C 0000 L1 600°C 0600