
2019.2


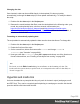

Table Of Contents
- Table of Contents
- Welcome to PrintShop Mail Connect 2019.2
- Setup And Configuration
- System and Hardware Considerations
- Installation and Activation
- Where to obtain the installer
- Installation - important information
- Installation - How to guides
- Activation
- Installation Prerequisites
- User accounts and security
- Installing PrintShop Mail Connect on Machines without Internet Access
- Installation Wizard
- Running Connect installer in Silent Mode
- Activating a License
- Migrating to a new workstation
- Upgrading
- Backup these folders
- Backup your database
- Preferences
- Clean-up Service preferences
- DataMapper preferences
- Database Connection preferences
- Editing preferences
- Email preferences
- Emmet preferences
- Engines preferences
- Hardware for Digital Signing preferences
- Language preferences
- Logging preferences
- Parallel Processing preferences
- Print preferences
- Project Wizards preferences
- Save preferences
- Scripting preferences
- Engines preferences
- Parallel Processing preferences
- Connect: a peek under the hood
- Known Issues
- Connect Updates failing due to Microsoft Visual C++ 2017 Redistributable prod...
- Issues associating PDF files with Connect.
- The OL Connect 2019.1 license update does not cater for existing AFP input li...
- The Update Client OL for Connect 2019.1 does not cater for standalone Connect...
- Page break changes in 2019.1
- Minor differences in AFP and IPDS output introduced in 2019.1
- Issue with image placement in 2019.1 when using some customized AFP and IPDS ...
- Issue after erroneous or incomplete update or re-installation
- Backend database might require periodic maintenance
- Windows 10 Search service impacting Connect
- Job Creation Presets: External Sorting change introduced in 2018.2
- Business Graphics: Backward Compatibility Issues introduced in 2018.1
- Known Font issues
- Minor differences in PCL, AFP and IPDS output introduced in 2018.1
- Windows Server 2016 issue
- Limit of 100MB of image files within a single job
- Print Output: Booklet Impositioning changes introduced in 2018.1
- Installation paths with multi-byte characters
- Switching languages
- GoDaddy certificates
- MySQL Compatibility
- Available Printer Models
- Color Model in Style Sheets
- Image preview in Designer
- VIPP Output
- Magic Number changes when installing Docker
- Uninstalling
- General information
- The Designer
- Designer basics
- Content elements
- Snippets
- Styling and formatting
- Personalizing content
- Preferences
- Clean-up Service preferences
- DataMapper preferences
- Database Connection preferences
- Editing preferences
- Email preferences
- Emmet preferences
- Engines preferences
- Hardware for Digital Signing preferences
- Language preferences
- Logging preferences
- Parallel Processing preferences
- Print preferences
- Project Wizards preferences
- Save preferences
- Scripting preferences
- Writing your own scripts
- Translating templates
- Designer User Interface
- Australia Post Settings
- Codabar Settings
- Code 39 Settings
- Code 128 Settings
- Data Matrix settings
- EAN-8 Settings
- EAN-13 Settings
- GS1-128 Settings
- Interleaved 2 of 5 Settings
- Japan Post Settings
- KIX Code (Dutch Post) Settings
- PDF417 Settings
- QR Code Settings
- Royal Mail 2D Mailmark Settings
- Royal Mail 4 State (CBC) Settings
- Royal Mail 4 State Mailmark C Settings
- Royal Mail 4 State Mailmark L Settings
- UPC-A Settings
- UPC-E Settings
- US Postal Service IMb Settings
- US Postal Service IMpb Settings
- Designer Script API
- Standard Script API
- Examples
- Examples
- Examples
- Examples
- Examples
- Examples
- Examples
- Examples
- Examples
- Examples
- Examples
- Examples
- Examples
- Example
- Example
- Example
- Example
- Example
- Examples
- Creating a table of contents
- Example
- Examples
- Examples
- Examples
- Examples
- Replace elements with a snippet
- Replace elements with a set of snippets
- Example
- Example
- Creating a Date object from a string
- Control Script API
- Examples
- Setting the margins of a Print section
- Setting the header and footer of a Master Page
- Examples
- Designer Script API
- Generating output
- Print Manager
- Print Manager Introduction Video
- Print Manager usage
- Print Manager Interface
- License Update Required for Upgrade to Connect 2019.x
- Backup before Upgrading
- Overview
- OL Connect 2019.2 Enhancements
- Connect 2019.2 Designer Improvements
- Connect 2019.2 Output Improvements
- Print Manager Improvements
- Known Issues
- Previous Releases
- License Update Required for Upgrade to Connect 2019.1
- Overview
- OL Connect 2019.1 Enhancements
- Connect 2019.1 Designer Updates
- Connect 2019.1 Output updates
- Print Wizard and Preset Wizard Improvements
- Known Issues
- Overview
- Connect 2018.2.1 Enhancements/Fixes
- Connect 2018.2 Enhancements
- Connect 2018.2 Designer Updates
- Connect 2018.2 Output updates
- Print Wizard and Preset Wizard Improvements
- Connect 2018.2 Print Manager updates
- Known Issues
- Overview
- Connect 2018.1.6 Enhancements/Fixes
- Connect 2018.1.5 Enhancements/Fixes
- Connect 2018.1.4 Enhancements/Fixes
- Connect 2018.1.3 Enhancements/Fixes
- Connect 2018.1.2 Enhancements/Fixes
- Connect 2018.1.1 Enhancements/Fixes
- Connect 2018.1 General Enhancements
- Connect 2018.1 Designer Enhancements/Fixes
- Connect 2018.1 Output Enhancements/Fixes
- Connect 2018.1 Print Manager Enhancements/Fixes
- Known Issues
- Overview
- Connect 1.8 General Enhancements and Fixes
- Connect 1.8 Performance Related Enhancements and Fixes
- Connect 1.8 Designer Enhancements and Fixes
- Connect 1.8 Output Enhancements and Fixes
- Connect 1.8 Print Manager Enhancements and Fixes
- Known Issues
- Overview
- Connect 1.7.1 General Enhancements and Fixes
- Connect 1.7.1 Designer Enhancements and Fixes
- Connect 1.7.1 Output Enhancements and Fixes
- Known Issues
- Overview
- Connect 1.6.1 General Enhancements and Fixes
- Connect 1.6.1 Designer Enhancements and Fixes
- Connect 1.6.1 Output Enhancements and Fixes
- Known Issues
- Overview
- Connect 1.5 Designer Enhancements and Fixes
- Connect 1.5 Output Enhancements and Fixes
- Connect 1.5 General Enhancements and Fixes
- Known Issues
- Overview
- Connect 1.4.2 Enhancements and Fixes
- Connect 1.4.1 New Features and Enhancements
- Connect 1.4.1 Designer Enhancements and Fixes
- Connect 1.4.1 Output Enhancements and Fixes
- Known Issues
- Knowledge Base
- Legal Notices and Acknowledgements

Note
Labels are used in the legend. They will be visible when the legend is enabled.
3.
Select a color for each of the selected fields. Click on the color to open the Edit Color
dialog (see "Color Picker" on page457).
Note
Colors defined in the Chart Properties dialog override the colors set in the script. To
open the Chart Properties dialog, right-click the chart after adding it, and select
Chart.... See: "Enhancing a charts' design" below.
4.
Use the Move Up and Move Down buttons to change the order of the fields, which is
reflected in the chart.
The Preview shows what the chart looks like with the current settings, whilst the Data Preview
shows which data will be passed to the amCharts library.
Enhancing a charts' design
Charts inserted with a wizard always have the same layout. The amCharts library that is
integrated in Connect has loads of options to layout charts differently. Here's how to make use
of those options.
Start by opening the Chart Properties dialog. Right-click the chart (in the template, or in the
Outline pane) and select Chart.
Every tab menu in the Chart Properties dialog, except the last one, gives direct access to a
number of layout options. For a description of the options see:
l "Bar Chart Properties dialog" on page444
l "Line Chart Properties dialog" on page474
l "Pie Chart Properties dialog" on page489
Page 262