
2019.1


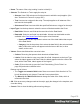
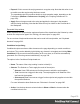
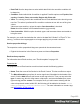
Table Of Contents
- Table of Contents
- Welcome to PrintShop Mail Connect 2019.1
- Setup And Configuration
- System and Hardware Considerations
- Installation and Activation
- Where to obtain the installers
- Installation - important information
- Installation - How to guides
- Activation
- Installation Prerequisites
- User accounts and security
- Installing PrintShop Mail Connect on Machines without Internet Access
- Installation Wizard
- Running Connect installer in Silent Mode
- Activating a License
- Migrating to a new workstation
- Preferences
- Upgrading
- Connect: a peek under the hood
- Known Issues
- The OL Connect 2019.1 license update does not cater for existing AFP input li...
- The Update Client OL for Connect 2019.1 does not cater for standalone Connect...
- Page break changes in 2019.1
- Minor differences in AFP and IPDS output introduced in 2019.1
- Issue with image placement in 2019.1 when using some customized AFP and IPDS ...
- Issue after erroneous or incomplete update or re-installation
- Backend database might require periodic maintenance
- Windows 10 Search service impacting Connect
- Job Creation Presets: External Sorting change introduced in 2018.2
- Business Graphics: Backward Compatibility Issues introduced in 2018.1
- Known Font issues
- Minor differences in PCL, AFP and IPDS output introduced in 2018.1
- Windows Server 2016 issue
- Limit of 100MB of image files within a single job
- Print Output: Booklet Impositioning changes introduced in 2018.1
- Installation Paths with Multi-Byte Characters
- Switching Languages
- GoDaddy Certificates
- MySQL Compatibility
- Available Printer Models
- Color Model in Style Sheets
- Image Preview in Designer
- VIPP Output
- Magic Number changes when installing Docker
- Uninstalling
- Connect: a peek under the hood
- Connect file types
- The Designer
- Designer basics
- Content elements
- Snippets
- Styling and formatting
- Personalizing content
- Preferences
- COTG Servers preferences
- Clean-up Service preferences
- Database Connection preferences
- DataMapper preferences
- Editing preferences
- Email Preferences
- Emmet Preferences
- Engine Setup
- Language Setting Preferences
- Log Setting Preferences
- Print Preferences
- Project Wizards
- Saving Preferences
- Scheduling Preferences
- Scripting Preferences
- Writing your own scripts
- Translating templates
- Designer User Interface
- Australia Post 4 State Settings
- Codabar Settings
- Code 128 Settings
- Code 39 Settings
- Datamatrix Settings
- EAN-128 Settings
- EAN-13 Settings
- EAN-8 Settings
- Interleaved 2 of 5 Settings
- KIX Code (Dutch Post) Settings
- Japan Post Settings
- PDF417 Settings
- QR Code Settings
- Royal Mail 4 State Settings
- Royal Mail 2D Settings
- UPC-A Settings
- UPC-E Settings
- US Postal Service IMB Settings
- US Postal Service IMPB Settings
- Designer Script API
- Standard Script API
- Examples
- Examples
- Examples
- Examples
- Examples
- Examples
- Examples
- Examples
- Examples
- Examples
- Examples
- Examples
- Examples
- Example
- Example
- Example
- Example
- Example
- Examples
- Creating a table of contents
- Example
- Examples
- Examples
- Examples
- Examples
- Replace elements with a snippet
- Replace elements with a set of snippets
- Example
- Example
- Creating a Date object from a string
- Control Script API
- Examples
- Post Pagination Script API
- Setting the margins of a Print section
- Setting the header and footer of a Master Page
- Designer Script API
- Generating output
- Print Manager
- Print Manager Introduction Video
- Print Manager usage
- Print Manager Interface
- License Update Required for Upgrade to Connect 2019.1
- Overview
- OL Connect 2019.1 Enhancements
- Connect 2019.1 Designer Updates
- Connect 2019.1 Output updates
- Print Wizard and Preset Wizard Improvements
- Known Issues
- Previous Releases
- Overview
- Connect 2018.2.1 Enhancements/Fixes
- Connect 2019.1 Enhancements
- Connect 2019.1 Designer Updates
- Connect 2019.1 Output updates
- Print Wizard and Preset Wizard Improvements
- Connect 2019.1 Print Manager updates
- Known Issues
- Overview
- Connect 2018.1.6 Enhancements/Fixes
- Connect 2018.1.5 Enhancements/Fixes
- Connect 2018.1.4 Enhancements/Fixes
- Connect 2018.1.3 Enhancements/Fixes
- Connect 2018.1.2 Enhancements/Fixes
- Connect 2018.1.1 Enhancements/Fixes
- Connect 2018.1 General Enhancements
- Connect 2018.1 Designer Enhancements/Fixes
- Connect 2018.1 Output Enhancements/Fixes
- Connect 2018.1 Print Manager Enhancements/Fixes
- Known Issues
- Overview
- Connect 1.8 General Enhancements and Fixes
- Connect 1.8 Performance Related Enhancements and Fixes
- Connect 1.8 Designer Enhancements and Fixes
- Connect 1.8 Output Enhancements and Fixes
- Connect 1.8 Print Manager Enhancements and Fixes
- Known Issues
- Overview
- Connect 1.7.1 General Enhancements and Fixes
- Connect 1.7.1 Designer Enhancements and Fixes
- Connect 1.7.1 Output Enhancements and Fixes
- Known Issues
- Overview
- Connect 1.6.1 General Enhancements and Fixes
- Connect 1.6.1 Designer Enhancements and Fixes
- Connect 1.6.1 Output Enhancements and Fixes
- Known Issues
- Overview
- Connect 1.5 Designer Enhancements and Fixes
- Connect 1.5 Output Enhancements and Fixes
- Connect 1.5 General Enhancements and Fixes
- Known Issues
- Overview
- Connect 1.4.2 Enhancements and Fixes
- Connect 1.4.1 New Features and Enhancements
- Connect 1.4.1 Designer Enhancements and Fixes
- Connect 1.4.1 Output Enhancements and Fixes
- Known Issues
- Knowledge Base
- Legal Notices and Acknowledgements

When execution is suspended the list includes the current call stack, including line numbers.
From top to bottom, frames are ordered from new to old. The current stack frame has an arrow
indicator. You will only see multiple stack frames if execution is suspended inside a function.
You can click a frame to make it the current frame. The Variables panel always reflects the state
of the current frame.
Source code
You can click any script at the left to view it in the source editor at the top right. An instruction
pointer in the left margin marks the current line.
The code is read-only, but clicking to the left of a line of code adds a breakpoint to it (except
when a line only contains a declaration). Note that breakpoints are discarded when the dialog
is closed.
Hovering over a variable in the code shows a tooltip with the value of that variable. The
variable can be nested, like fields in record.fields.
Variables
At the bottom right the Script Debugger shows a hierarchical overview of all local and global
variables and their state. This information is always relative to the current stack frame, which is
the one that's selected on the left.
The overview includes the special entry "(this)", which represents the JavaScript "this" object.
If the current script is not a Control Script, the overview also includes the special entry "
(resource)". When expanded, this entry shows the HTML of the current Master Page or section,
allowing you to see exactly how each line in the script affects the DOM.
Use the Copy button (or press Ctrl+C) to copy the label and contents of the selected variable
and all of its children to the clipboard.
Expressions
You can add custom expressions at the top of the list of variables. This is especially useful
when you want to monitor the value of a variable that is situated at a lower level in the
hierarchy. For example, if you'd want to directly see the height of the top margin of a section as
you step through the code, you could add the following expression:
merge.section.margins.top.
Expressions can include function calls. For example, you could monitor the height of an
element that has the ID my_div with the expression: query("#my_div").height(). Note that the
query in this example will be limited to the current resource (Master Page or section).
You could also change the value of a variable through an expression to see how that affects the
Page 473