
2018.1

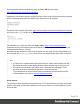
Table Of Contents
- Table of Contents
- Welcome to PrintShop Mail Connect 2018.1
- Setup And Configuration
- System and Hardware Considerations
- Installation and Activation
- Where to obtain the installers
- Installation - important information
- Installation - How to guides
- Activation
- Installation prerequisites
- User accounts and security
- Installing PrintShop Mail Connect on Machines without Internet Access
- Installation Wizard
- Running connect installer in Silent Mode
- Activating a License
- Migrating to a new workstation
- Preferences
- Connect: a peek under the hood
- Known Issues
- Business Graphics: Backward Compatibility Issues
- Minor differences in PCL, AFPDS and IPDS output introduced in 2018.1
- Windows Server 2016 issue
- No switch for case sensitivity in Dynamic Printer Rules editor
- Limit of 100MB of image files within a single job
- Print Output: Booklet Impositioning changes introduced in 2018.1
- Installation Paths with Multi-Byte Characters
- Switching Languages
- GoDaddy Certificates
- MySQL Compatibility
- Available Printer Models
- Colour Model in Stylesheets
- Image Preview in Designer
- VIPP Output
- Uninstalling
- Connect: a peek under the hood
- Connect File Types
- The Designer
- Codabar Settings
- Code 128 Settings
- Code 39 Settings
- Data Matrix Settings
- EAN-128 Settings
- EAN-13 Settings
- EAN-8 Settings
- Interleaved 2 of 5 Settings
- PDF417 Settings
- QR Code Settings
- UPC-A Settings
- UPC-E Settings
- Designer Script API
- Designer Script API
- Examples
- Examples
- Examples
- Examples
- Examples
- Examples
- Examples
- Examples
- Examples
- Examples
- Examples
- Examples
- Examples
- Example
- Example
- Example
- Example
- Example
- Examples
- Creating a table of contents
- Example
- Examples
- Examples
- Examples
- Examples
- Replace elements with a snippet
- Replace elements with a set of snippets
- Example
- Example
- Creating a Date object from a string
- Control Script API
- Examples
- Designer Script API
- Generating output
- Print output
- Email output
- Optimizing a template
- Generating Print output
- Saving Printing options in Print Presets
- Connect Printing options that cannot be changed from within the Printer Wizard
- Print Using Standard Print Output Settings
- Print Using Advanced Printer Wizard
- Adding print output models to the Print Wizard
- Splitting printing into more than one file
- Print output variables
- Generating Email output
- Print Manager
- Print Manager Introduction Video
- Print Manager usage
- Print Manager Interface
- Overview
- Connect 2018.1.6 Enhancements/Fixes
- Connect 2018.1.5 Enhancements/Fixes
- Connect 2018.1.4 Enhancements/Fixes
- Connect 2018.1.3 Enhancements/Fixes
- Connect 2018.1.2 Enhancements/Fixes
- Connect 2018.1.1 Enhancements/Fixes
- Connect 2018.1 General Enhancements
- Connect 2018.1 Designer Enhancements/Fixes
- Connect 2018.1 Output Enhancements/Fixes
- Connect 1.8 Print Manager Enhancements/Fixes
- Known Issues
- Overview
- Connect 2018.1.2 Enhancements/Fixes
- Connect 2018.1.1 Enhancements/Fixes
- Connect 2018.1 General Enhancements
- Connect 2018.1 Designer Enhancements/Fixes
- Connect 2018.1 Output Enhancements/Fixes
- Connect 1.8 Print Manager Enhancements/Fixes
- Known Issues
- Overview
- Connect 2018.1.1 Enhancements/Fixes
- Connect 2018.1 General Enhancements
- Connect 2018.1 Designer Enhancements/Fixes
- Connect 2018.1 Output Enhancements/Fixes
- Connect 1.8 Print Manager Enhancements/Fixes
- Known Issues
- Overview
- Connect 2018.1 General Enhancements
- Connect 2018.1 Designer Enhancements/Fixes
- Connect 2018.1 Output Enhancements/Fixes
- Connect 1.8 Print Manager Enhancements/Fixes
- Known Issues
- Previous Releases
- Overview
- Connect 1.8 General Enhancements and Fixes
- Connect 1.8 Performance Related Enhancements and Fixes
- Connect 1.8 Designer Enhancements and Fixes
- Connect 1.8 Output Enhancements and Fixes
- Connect 1.8 Print Manager Enhancements and Fixes
- Known Issues
- Overview
- Connect 1.7.1 General Enhancements and Fixes
- Connect 1.7.1 Designer Enhancements and Fixes
- Connect 1.7.1 Output Enhancements and Fixes
- Known Issues
- Overview
- Connect 1.6.1 General Enhancements and Fixes
- Connect 1.6.1 Designer Enhancements and Fixes
- Connect 1.6.1 Output Enhancements and Fixes
- Known Issues
- Overview
- Connect 1.5 Designer Enhancements and Fixes
- Connect 1.5 Output Enhancements and Fixes
- Connect 1.5 General Enhancements and Fixes
- Known Issues
- Overview
- Connect 1.4.2 Enhancements and Fixes
- Connect 1.4.1 New Features and Enhancements
- Connect 1.4.1 Designer Enhancements and Fixes
- Connect 1.4.1 Output Enhancements and Fixes
- Known Issues
- Legal Notices and Acknowledgements

l A Div element. It has a data-amchart attribute, as you can see when you select the
chart and open the Source view in the Workspace. The data-amchart attribute
contains settings for how the data is displayed. These settings are made via the chart's
properties (see "Enhancing a charts' design" on the facing page).
l A script. The script determines which data are displayed in the chart, with which colors
and labels. The script can be edited any time; see "Selecting data in a Business Graphic
script" below.
When a preview or output must be generated, the script adds the data for the chart to the
data-amchart attribute (in a dataProvider property). Connect then passes the
value of that attribute to the integrated amCharts library.
Selecting data in a Business Graphic script
A Business Graphic script determines which data, colors and labels are used in the chart.
Double-click the script on the Scripts pane to open it.
Tip
To find the script that provides data for a chart, hover over the names of the script in the Scripts
pane. That particular script will highlight the chart in the template and its selector is the same as the
ID of the business graphic (preceded by #).
1.
Next to Values, select data fields with a numerical value.
2.
Adjust the label of each of the selected data fields as needed: click on the label and type
the new one.
In Bar and Line Charts with Data Fields as input data, these labels appear under the x-
axis of the chart.
Note
Labels are used in the legend. They will be visible when the legend is enabled.
3.
Select a color for each of the selected fields: click on the color to open the Edit Color
dialog.
The Preview shows what the chart looks like with the current settings, whilst the Data Preview
shows which data will be passed to the amCharts library.
Page 217