
1.8


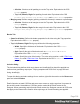
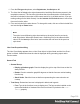

Table Of Contents
- Table of Contents
- Welcome to PrintShop Mail Connect 1.8
- Setup And Configuration
- System and Hardware Considerations
- Installation and Activation
- Where to obtain the installers
- Installation - important information
- Installation - How to guides
- Activation
- Installation Prerequisites
- User accounts and security
- The Importance of User Credentials on Installing and Running PrintShop Mail C...
- Installing PrintShop Mail Connect on Machines without Internet Access
- Installation Wizard
- Running connect installer in Silent Mode
- Activating a License
- Migrating to a new workstation
- Known Issues
- Uninstalling
- Connect: a peek under the hood
- Connect File Types
- The Designer
- Designer basics
- Content elements
- Snippets
- Styling and formatting
- Personalizing Content
- Writing your own scripts
- Designer User Interface
- Designer Script API
- Designer Script API
- Examples
- Examples
- Examples
- Examples
- Examples
- Examples
- Examples
- Examples
- Examples
- Examples
- Examples
- Examples
- Examples
- Example
- Example
- Example
- Example
- Example
- Examples
- Creating a table of contents
- Example
- Examples
- Examples
- Examples
- Examples
- Replace elements with a snippet
- Replace elements with a set of snippets
- Example
- Example
- Creating a Date object from a string
- Control Script API
- Examples
- Generating output
- Print output
- Email output
- Optimizing a template
- Generating Print output
- Saving Printing options in Print Presets
- Connect Printing options that cannot be changed from within the Printer Wizard
- Print Using Standard Print Output Settings
- Print Using Advanced Printer Wizard
- Adding print output models to the Print Wizard
- Splitting printing into more than one file
- Print output variables
- Generating Email output
- Print Manager
- Print Manager Introduction Video
- Print Manager usage
- Print Manager Interface
- Overview
- Connect 1.8 General Enhancements and Fixes
- Connect 1.8 Performance Related Enhancements and Fixes
- Connect 1.8 Designer Enhancements and Fixes
- Connect 1.8 Output Enhancements and Fixes
- Connect 1.8 Print Manager Enhancements and Fixes
- Known Issues
- Previous Releases
- Overview
- Connect 1.7.1 General Enhancements and Fixes
- Connect 1.7.1 Designer Enhancements and Fixes
- Connect 1.7.1 Output Enhancements and Fixes
- Known Issues
- Overview
- Connect 1.6.1 General Enhancements and Fixes
- Connect 1.6.1 Designer Enhancements and Fixes
- Connect 1.6.1 Output Enhancements and Fixes
- Known Issues
- Overview
- Connect 1.5 Designer Enhancements and Fixes
- Connect 1.5 Output Enhancements and Fixes
- Connect 1.5 General Enhancements and Fixes
- Known Issues
- Overview
- Connect 1.4.2 Enhancements and Fixes
- Connect 1.4.1 New Features and Enhancements
- Connect 1.4.1 Designer Enhancements and Fixes
- Connect 1.4.1 Output Enhancements and Fixes
- Known Issues
- Legal Notices and Acknowledgements

1.
From the File types dropdown, select Stylesheets, JavaScripts or all.
2. The list at the left displays the style sheets and/or JavaScript files that are present in the
template's resources. The list at the right shows the style sheets and or JavaScript files
that will be included in the output of the current section (or in all Web sections, if you are
making settings for the Web context). Use the Include and Exclude buttons to move files
from one list to the other.
3. Files are included in the order shown. To change this order, click one of the included files
and use the Up or Down button.
Note
The styles in each following style sheet add up to the styles found in previously
read style sheets. When style sheets have a conflicting rule for the same element,
class or ID, the last style sheet ‘wins’ and overrides the rule found in the previous
style sheet.
Line Chart Properties dialog
The Line Chart dialog appears when a Line Chart object is right-clicked and the Line Chart...
option is clicked. It determines how the chart is displayed when generating output and in
Preview mode.
General Tab
l
General Group:
l
Display grid above graph: Check to display the grid on top of the lines so that it is
always visible.
l
Rotate: Check to rotate the graph 90 degrees so that the lines are vertical starting
from the top.
l
Stack Series: Stack the lines so that lines representing the same value do not
overlap.
l
Text Group: Determines how text is displayed in labels and legends.
l
Font: Type in the font-face to use to display text. The font must be installed on the
system and defaults to Verdana if the font is not found. Equivalent to the font-
family property.
Page 319