
1.6
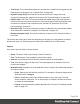

Table Of Contents
- Table of Contents
- Welcome to PrintShop Mail Connect 1.6.1
- Setup And Configuration
- System and Hardware Considerations
- Installation and Activation
- Installation Pre-Requisites
- User accounts and security
- The Importance of User Credentials on Installing and Running PrintShop Mail C...
- Installing PrintShop Mail Connect on Machines without Internet Access
- Installation Wizard
- Running Connect Installer in Silent Mode
- Activating a License
- Migrating to a new computer
- Uninstalling
- The Designer
- Generating output
- Optimizing a template
- Generating Print output
- Saving Printing options in Printing Presets.
- Connect Printing options that cannot be changed from within the Printer Wizard.
- Print Using Standard Print Output Settings
- Print Using Advanced Printer Wizard
- Adding print output models to the Print Wizard
- Splitting printing into more than one file
- Variables available in the Output
- Generating Tags for Image Output
- Generating Email output
- Print Manager
- Release Notes
- Copyright Information
- Legal Notices and Acknowledgments

Epanded Script window
When expanded, the Script window replaces all parts of the wizard below the Selector by a box
in which the script can be typed. See "Writing your own scripts" on page221.
Chart Script dialog
These are the options in the Chart Script dialog:
l
Name: The name of the script, making it easier to identify it.
l
Find: The Selector or Text to apply the result of the script to.
l
Selector: Uses CSS selectors to find the element to which the script applies.
l
Text: Uses text as a trigger for the script. The script applies to all instances of the
text found in the template.
l
Selector and Text: Uses text as a trigger for the script but only applies to text within
the specified Selector.
l
Input Type: Use the drop-down to select the source of the data to add to the Chart. The
selection changes the options below:
l
Static Labels: Select to use a static number of data lines below. The chart will
always have the same number of items.
l
Data List: Lists the data lines that are part of the Chart. Each line represents a
segment of the pie as well as a label if they are shown.
l
Labels: The text of the label to display next to the Chart or within the
legends.
l
Values: The value that will be used to create the Chart. This is the name
of a field within the Data Model.
l
Add: Click to add an entry to the Data List. Opens the Edit Label Properties
dialog.
l
Delete: Click to delete the currently selected line in the Data List.
l
Move Up: Click to move the currently selected line up one position.
l
Move Down: Click to move the currently selected line down one position.
l
Dynamic Labels: Select to use data from a detail table to fill the Chart dynamically.
At least one detail table must be available in the Data Model Pane for this option to
be functional.
Page 296