
1.6
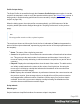

Table Of Contents
- Table of Contents
- Welcome to PrintShop Mail Connect 1.6.1
- Setup And Configuration
- System and Hardware Considerations
- Installation and Activation
- Installation Pre-Requisites
- User accounts and security
- The Importance of User Credentials on Installing and Running PrintShop Mail C...
- Installing PrintShop Mail Connect on Machines without Internet Access
- Installation Wizard
- Running Connect Installer in Silent Mode
- Activating a License
- Migrating to a new computer
- Uninstalling
- The Designer
- Generating output
- Optimizing a template
- Generating Print output
- Saving Printing options in Printing Presets.
- Connect Printing options that cannot be changed from within the Printer Wizard.
- Print Using Standard Print Output Settings
- Print Using Advanced Printer Wizard
- Adding print output models to the Print Wizard
- Splitting printing into more than one file
- Variables available in the Output
- Generating Tags for Image Output
- Generating Email output
- Print Manager
- Release Notes
- Copyright Information
- Legal Notices and Acknowledgments

Profile Scripts dialog
The Script Profiler is accessible through the Context >Profile Scripts menu option. It runs the
scripts in the template in order to verify the speed at which scripts in the Scripts Pane execute. It
helps greatly in troubleshooting performance issues caused by scripting (see also: "Testing
scripts" on page229).
When the dialog opens, the script profiler runs automatically, on 1000 instances of all the
scripts by default (this can be changed through the "Scripting Preferences" on the previous
page).
Note
The script profiler can take a while, so please be patient.
The results are shown as follows (the first in the line is indicated as Total and represents the
totals of all the scripts underneath, representing a good overview of the scripts performance in
the template):
l
Name: The name of the script being executed.
l
Count: As the profiler runs, Count shows the current number of iterations that have been
run. This goes up to the total number of set instances and then stops. Hover with your
mouse to display a tooltip indicating in which sections the scripts has run (and in which
contexts).
l
Elapsed: Displays the total elapsed time since the start of the session. The table entries
are initially sorted based on the values in this column, from high to low. Hovering the
mouse over it will display a tooltip that indicates the breakdown of the execution time
across different execution stages.
l
Delta: Displays the estimated difference in performance between the current session and
the previous session. Uses average values, so should still work if the previous session
was stopped after a different number of iterations. Will be empty if no previous data is
available. Hover with your mouse to display a tooltip indicating the breakdown of the
execution time across different execution stages.
Script wizards
Wizard types
Script wizards are simplified interfaces for common scripts in templates:
Page 293