
1.6
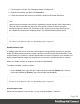

Table Of Contents
- Table of Contents
- Welcome to PrintShop Mail Connect 1.6.1
- Setup And Configuration
- System and Hardware Considerations
- Installation and Activation
- Installation Pre-Requisites
- User accounts and security
- The Importance of User Credentials on Installing and Running PrintShop Mail C...
- Installing PrintShop Mail Connect on Machines without Internet Access
- Installation Wizard
- Running Connect Installer in Silent Mode
- Activating a License
- Migrating to a new computer
- Uninstalling
- The Designer
- Generating output
- Optimizing a template
- Generating Print output
- Saving Printing options in Printing Presets.
- Connect Printing options that cannot be changed from within the Printer Wizard.
- Print Using Standard Print Output Settings
- Print Using Advanced Printer Wizard
- Adding print output models to the Print Wizard
- Splitting printing into more than one file
- Variables available in the Output
- Generating Tags for Image Output
- Generating Email output
- Print Manager
- Release Notes
- Copyright Information
- Legal Notices and Acknowledgments

l
The information icon (i) shows that the selector of the script does not produce a result in
the current section.
l
The warning icon (!) appears, for example, when a script refers to an unknown field in
the record set, or when ; is missing after a statement.
l
The error icon (x) displays when the script results in an error, for example, when it uses
an undeclared variable.
In addition to the icons and messages in the Scripts pane, there is another way to see if your
scripts function as expected before generating output:
l
On the Context menu, click Preflight.
Preflight executes the template without actually producing output and it displays any issues
once it’s done.
It will tell, for example, which selectors were not encountered in the template.
Test for speed issues
To measure the time that the execution of scripts will take:
l
On the Context menu, click Profile scripts.
Profiling means running the scripts in the template, to see how fast scripts in the Scripts pane
execute. It helps greatly in troubleshooting performance issues caused by scripts.
After running the Script Profiler you can see in which sections the script has run:
l
Hover the mouse over a value in the column Count to see the number of times that the
script has run, per section.
You can also see the breakdown of the execution time across different execution stages:
Page 230