
manual

Getting Started
O&O CleverCache - 17
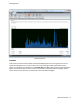
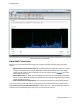
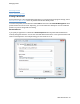
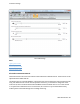
System cache view
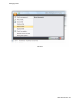
Hard disk
In this section, the load on the hard disk is measured and displayed over time as a graph. The units are
explained in the legend. You can use a smaller view on the start page of O&O CleverCache (Control
Center). You will find a more detailed view under hard disk in the Ribbon Bar. The units are explained in the
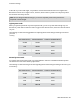
legend. The statistical values for mean, maximum, and minimum can be found below the graph. The sta-
tistical values for mean, maximum, and minimum can be found below the graph.