
Manual
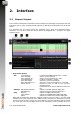
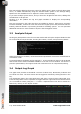
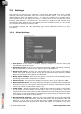

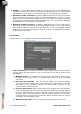
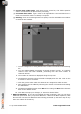
Table Of Contents

Files may also be added to the queue using the ‘Add to queue’ option in the File drop-down
menu, or added automatically using the watched folder option in the settings dialog.
Options are also available here to adjust the results column display.
If you have multiple queues active, and you have the ’All Queues’ tab active, adding files
will add them to all queues.
Clicking on a file updates the log and graph windows to display the corresponding
information.
Files are processed in the order that they were added to queues. Each time a processor
becomes available, it takes the next item from the longest queue and processes that file.
Initially, AMB will allocate 2 processing threads for handling queues. You can purchase
additional licenses for more threads to improve the throughput of files.
2.3 Analysis Output
Clicking any analysed file in the file overview window will call up the analysis details for that
file in the analysis output window, showing file location, format, and processing details.
When processing for loudness, values that fail the specification criteria are marked with an
exclamation mark.
A critical file failure parameter will be marked ‘!!’. A corrected file will then not be produced
and the file will be marked ‘CANNOT CORRECT’ in the file overview window. For the file to
pass the specifications, the original audio will need some form of compression/limiting.
2.4 Output Log Graph
The graph area provides a thumbnail overview of Short-term, Momentary loudness and
True-Peak over time. The three traces can be toggled on and off by clicking the title in the
key.
The magnifying glass in the right hand corner will open a second, large-scale graph view.
From the large scale-view it is possible to toggle between original and corrected file traces
(if a corrected file exists) using the ‘<->’ button. Graphical traces can also be saved as a
PNG file by clicking on the ‘Export’ button.
6 © 2016 NUGEN Audio www.nugenaudio.com